News Release
Conagra Brands Reports Third Quarter Results
Strong Growth in Legacy Conagra Frozen and Snacks Businesses as Brand-Building and Innovation Efforts Paying Off
CHICAGO, March 21, 2019 /PRNewswire/ -- Today Conagra Brands, Inc. (NYSE: CAG) reported results for the third quarter of fiscal year 2019, which ended on February 24, 2019. All comparisons for Legacy Conagra results are against the prior-year fiscal period, unless otherwise noted. Certain terms used in this release, including "organic net sales," "Legacy Conagra," "pro forma," "EBITDA," and certain "adjusted" results, are defined under the section entitled "Definitions."
Highlights
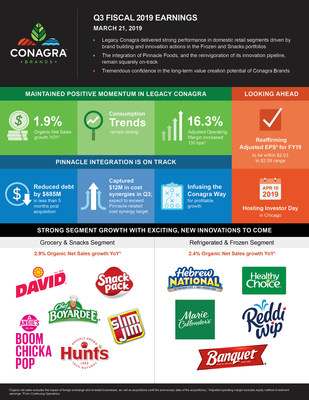
- Net sales grew 35.7%, driven primarily by the Pinnacle Foods acquisition. Organic net sales excluding the sale of the Trenton, Missouri production facility (Trenton) increased 1.9%.
- The Grocery & Snacks segment grew net sales by 2.9% behind continued strong performance in the Legacy Conagra snacks business.
- The Refrigerated & Frozen segment continued its positive momentum in the third quarter, with net sales growth of 3.3% and organic net sales growth of 2.4%, driven by innovation.
- Diluted earnings per share (EPS) from continuing operations was $0.50, and adjusted diluted EPS from continuing operations was $0.51 in the quarter. Solid operating performance in Legacy Conagra continued. Taxes, interest expense, and lower joint venture earnings associated with Legacy Conagra in the quarter, and the dilutive impacts of Pinnacle, reduced overall EPS.
- The Company's integration of the Pinnacle business, which was acquired in October 2018, remains on track. The Company realized approximately $12 million of cost synergies in the quarter and continues to expect to exceed its previously-announced $215 million cost synergy target.
- As of today, the Company has reduced debt by $685 million since the end of the second quarter.
- With approximately two months remaining in the fiscal year and the Wesson transaction complete, the Company has updated its fiscal year 2019 outlook, including reaffirming its guidance for adjusted diluted EPS from continuing operations.
- The Company will host an Investor Day on April 10, 2019 in Chicago where it will share more information on the value creating opportunities ahead, including an update on its robust innovation slate, Pinnacle cost synergy opportunities, and the Company's long-term financial algorithm.
CEO Perspective
Sean Connolly, president and chief executive officer of Conagra Brands, commented, "Our Legacy Conagra business generated solid growth during the third quarter and delivered strong performance in our domestic retail segments. We saw continued improvement in consumption trends and base sales velocity, and organic net sales grew nearly two percent during the quarter. Our brand building and innovation actions over the past several years have resulted in strong growth in our frozen and snacks portfolios, and we remain focused on applying this disciplined approach across our portfolio."
He added, "The integration of Pinnacle Foods, and the reinvigoration of its innovation pipeline, remain squarely on-track. We are aggressively applying our proven 'Conagra Way' to address the executional challenges in the Birds Eye, Duncan Hines and Wish-Bone businesses. While it will take some time to return these Pinnacle businesses to growth, we are confident that we have identified the issues and have the right action plans in place to improve the performance of these terrific brands. We have tremendous confidence in the long-term value creation potential of Conagra Brands and look forward to providing a comprehensive update at our upcoming Investor Day on April 10."
Total Company Third Quarter Results
In the quarter, net sales increased 35.7%. Reported net sales growth reflects:
- A 34.3 percentage point net benefit from the acquisitions of Pinnacle Foods and Sandwich Bros. of Wisconsin, the divestiture of the Canadian Del Monte business, and the sale of Trenton;
- A 0.5 percentage point decrease from foreign exchange; and
- 1.9 percentage points of growth in organic net sales, excluding Trenton
The 1.9% growth in organic net sales, excluding Trenton, in the quarter was largely in line with expectations. These results reflect a 1.2 percentage point increase in Legacy Conagra volume. In addition, price/mix improved 0.7 percentage points in the Legacy Conagra business as favorable pricing and mix were partially offset by increased investments with retailers to drive brand saliency, enhanced distribution, and consumer trial. The Company estimates the organic growth rate was reduced by 1.4 percentage points due to the increase in brand building investments with retailers, which was funded by reductions in certain lower-return advertising and promotion (A&P) investments.
Gross profit increased 25.6% to $752 million in the quarter. Adjusted gross profit increased 30.5% to $781 million, or 28.9% of net sales. The addition of Pinnacle's gross profit, together with supply chain realized productivity and improved price/mix in the Legacy Conagra business, more than offset higher transportation and input costs as well as the previously-mentioned brand building investments with retailers. Pinnacle's gross margin performance in the quarter was dilutive to the Company's overall gross margin, and the shift from A&P expense to brand building investments with retailers reduced gross margin by approximately 100 basis points.
Selling, general, and administrative expenses (SG&A), which include A&P expense, decreased 5.1% to $334 million in the quarter. Adjusted SG&A, which excludes A&P, increased 23.4% to $274 million, primarily as a result of the addition of expenses associated with the Pinnacle business, partially offset by lower incentive compensation expense due to a lower stock price compared to the prior-year period.
The Company's A&P expense decreased 13.9% to $67 million in the quarter as the Company continued to shift brand investments in the Legacy Conagra business from certain lower-return A&P marketing investments to brand building investments with retailers.
Net interest expense increased $91 million to $131 million in the quarter. The increase was primarily driven by higher levels of debt outstanding compared to the prior-year period, which was largely a result of the net debt incurred in connection with the Pinnacle acquisition.
The average diluted share count of 487 million shares reflects an increase of 85 million shares versus the prior year period. The increase was driven by the shares issued in connection with the Pinnacle acquisition, partially offset by share repurchases executed during fiscal 2018.
In the quarter, net income attributable to Conagra Brands was $242 million or $0.50 per diluted share. Adjusted net income attributable to Conagra Brands was $251 million or $0.51 per diluted share in the third quarter, as compared to $245 million and $0.61, respectively, in the prior-year period. The increase in adjusted net income attributable to Conagra Brands was driven by higher operating profit, which was partially offset by higher interest expense, a higher tax rate, and lower earnings in the Ardent Mills joint venture. The decrease in adjusted diluted EPS from continuing operations was primarily driven by the previously-mentioned increase in share count.
Adjusted EBITDA, which includes equity method investment earnings and pension and postretirement non-service income, increased 35.9% to $554 million in the quarter, driven by the addition of Pinnacle's operating profit and growth in Legacy Conagra's operating profit.
Grocery & Snacks Segment Third Quarter Results
Net sales for the Grocery & Snacks segment increased 2.9% to $863 million in the quarter. The Company's focus on building a strong snacks business delivered strong results in the quarter. Net sales of businesses in the snacks portfolio grew 8.2%, led by Orville Redenbacher's, Act II, Snack Pack, Slim Jim, and Duke's branded products. Volume increased 2.1% behind the strong growth in snacks, and price/mix increased 0.8% in the period as favorable pricing and mix more than offset increased brand building investments with retailers, which were funded by shifting dollars from A&P.
Operating profit for the segment increased 10.2% to $194 million in the quarter, and adjusted operating profit increased 9.8% to $196 million. Net sales growth, lower SG&A, and the benefits of supply chain realized productivity more than offset higher transportation and input costs.
Refrigerated & Frozen Segment Third Quarter Results
Net sales for the Refrigerated & Frozen segment increased 3.3% to $711 million in the quarter, and organic net sales grew 2.4%. The acquisition of Sandwich Bros. of Wisconsin, which closed late in the third quarter last year, added 90 basis points to the net sales growth rate. Volume grew 3.5% behind strong growth across the frozen portfolio, including the Marie Callender's, Healthy Choice, Banquet, P.F. Chang's, and Frontera brands. Price/mix decreased 1.1% as favorable pricing and mix were more than offset by increased brand building investments with retailers, which were funded by shifting dollars from A&P.
Reported and adjusted operating profit both grew 4.2% to $131 million and $132 million, respectively. Net sales growth and realized productivity more than offset unfavorable price/mix, higher SG&A, and higher transportation and input costs.
International Segment Third Quarter Results
Net sales for the International segment decreased 11.4% to $198 million in the quarter. The sale of the Canadian Del Monte business reduced the net sales growth rate by approximately 640 basis points, and the impact of foreign exchange unfavorably impacted the net sales growth rate by 415 basis points. Organic net sales decreased 0.9% as favorable price/mix of 1.1% was more than offset by volume declines, concentrated in certain lower-growth global markets, of 2.0%.
Operating profit decreased 15.0% to $25 million in the quarter. Adjusted operating profit decreased 13.0% as the impact of higher input costs, increased A&P investments, and the Canadian Del Monte business divestiture more than offset favorable price/mix and lower SG&A.
Foodservice Segment Third Quarter Results
Net sales for the Foodservice segment decreased 8.7% to $223 million in the quarter, and organic net sales excluding Trenton decreased 0.6%. The sale of the Trenton facility reduced the net sales growth rate by 810 basis points. Price/mix increased 6.1% and volume declined 6.7% in the quarter as the segment continued to execute its value-over-volume strategy.
Operating profit increased 21.5% to $29 million in the quarter, and operating margin expanded 326 basis points. The impacts of favorable price/mix, supply chain realized productivity, and lower SG&A were partially offset by the impacts of higher input costs and the sale of the Trenton facility.
Pinnacle Segment Third Quarter Results
Net sales for the Pinnacle segment totaled $712 million in the period, which reflects a mid-single-digit percentage point decline versus the comparable year ago period on a pro forma basis. As expected, consumption declined during the quarter. Consumption growth in brands including Vlasic, Armour, and Gardein were more than offset by declines in brands including Birds Eye, Wish-Bone, and Duncan Hines. Additionally, the segment's year-over-year performance was negatively impacted by this year's later Easter holiday.
Operating profit for the Pinnacle segment totaled $102 million in the period, and adjusted operating profit was $130 million. This performance, which was above expectations, was driven by lower than expected SG&A as well as approximately $12 million of synergies that were delivered ahead of schedule.
Additionally, $19 million of adjusted corporate expenses related to the acquired Pinnacle business have been accounted for in the Company's total corporate expenses and not in the Pinnacle segment. This was in line with the Company's expectations.
The overall integration of the Pinnacle business remains on-track, with people, process, and systems integration workstreams achieving planned milestones. The Company has also made significant progress reinvigorating Pinnacle's multi-year innovation pipeline with a focus on Birds Eye, Duncan Hines, and Wish-Bone.
Other Third Quarter Items
Corporate expenses decreased $46 million to $63 million in the quarter. Adjusted corporate expenses increased 20.3% to $73 million in the quarter, $54 million of which is related to Legacy Conagra and $19 million of which is related to Pinnacle. Favorability in incentive compensation expense, including lower stock-based compensation expense due to a lower stock price compared to the prior-year period, was more than offset by the addition of Pinnacle-related expenses.
Pension and post-retirement non-service income decreased 55.4%, or $12 million, to $10 million in the quarter, reflecting the previously-disclosed asset mix shift in the Company's pension plans.
Equity method investment earnings decreased 56.2% to $13 million in the period, and adjusted equity method investment earnings decreased 48.6%. Lower commodity margins and the timing of certain customer contracts negatively impacted the performance of the Ardent Mills joint venture during the quarter.
In the quarter, the effective tax rate was 21.7%, and the adjusted effective tax rate was 24.3%.
In the quarter, the Company paid a dividend of $0.2125 per share.
The Company remains committed to a solid investment grade credit rating. Aligned with that commitment and the leverage ratio target of 3.5 times debt to last twelve month adjusted EBITDA, the Company reduced debt by $685 million in fewer than five months after completing the Pinnacle acquisition. The Company reduced debt by $435 million in the third quarter; the Company repaid an additional $250 million of debt in the fourth quarter through March 21, 2019.
Portfolio Update
As previously announced, following the conclusion of the third quarter, on February 25, 2019, the Company completed the divestiture of the Wesson oil brand, selling all assets exclusively related to the business, including a facility in Memphis, Tennessee. The Company used the net proceeds from the transaction to pay down debt in the fourth quarter.
Fiscal 2019 Outlook
With approximately two months left in fiscal 2019, and the sale of the Wesson oil business now complete, the Company is updating its fiscal 2019 outlook. Prior guidance included Wesson for the full fiscal year. The updated organic net sales growth guidance removes Wesson for the entire fiscal year. All other metrics include Wesson's actual results only for the time period the business was owned and now exclude expected results for the remainder of the fiscal year.
Total Conagra | Prior FY19 Guidance | Updated FY19 Guidance |
Organic Net Sales Growth | +1.0% to +2.0% | Approximately +1% |
Adj. Gross Margin | 29.3% to 29.6% | Below Range |
Adj. Operating Margin | 14.9% to 15.2% | Above Range |
Adj. Effective Tax Rate | 24% to 25% | No Change |
Adj. Net Interest Expense | $390 to $395 million | Below Range |
Avg. Diluted Shares | ~ 446 million | No Change |
Adj. Diluted EPS from Cont. Ops. | $2.03 to $2.08 | No Change |
FY19 Synergies | $20 million | Above Range |
FY19 Transaction-Related Amortization | $17 million | No Change |
Pinnacle (incl. Pinnacle-related corporate expense) | Prior FY19 Guidance | Updated FY19 Guidance |
Reported Net Sales | $1.70 to $1.75 billion | $1.71 to $1.73 billion |
Adj. Operating Margin | 14.6% to 14.9% | Near High-End of Range |
The inability to predict the amount and timing of the impacts of foreign exchange, acquisitions, divestitures, and other items impacting comparability makes a detailed reconciliation of these forward-looking non-GAAP financial measures impracticable. Please see the end of this release for more information.
Items Affecting Third Quarter Fiscal 2019 Comparability
Included in the $0.50 diluted EPS from continuing operations for the third quarter of fiscal 2019 (EPS amounts rounded and after tax)
- Approximately $0.06 per diluted share of net expense, or $38.4 million pre-tax ($28.7 million after tax), related to restructuring plans ($1.9 million in COGS and $36.5 million in SG&A)
- Approximately $0.04 per diluted share of net expense, or $26.9 million pre-tax ($20.0 million after tax), related to a fair value adjustment to Pinnacle's inventory valuation in connection with our acquisition accounting (COGS)
- Approximately $0.06 per diluted share of net benefit, or $27.3 million pre-tax ($27.3 million after tax), related to the novation of a legacy guarantee relating to a divested business (SG&A)
- Approximately $0.04 per diluted share of net benefit, or $18.6 million pre-tax ($17.5 million after tax), related to a fair value adjustment of cash settleable equity awards issued in connection with the Pinnacle acquisition (SG&A)
- Approximately $0.01 per diluted share of net tax expense, or $2.5 million, related to unusual tax items (Tax)
Included in the $0.87 diluted EPS from continuing operations for the third quarter of fiscal 2018 (EPS amounts rounded and after tax)
- Approximately $0.03 per diluted share of net expense, or $14.7 million pre-tax ($10.8 million after tax), related to restructuring plans ($0.1 million benefit in COGS and $14.8 million expense in SG&A)
- Approximately $0.01 per diluted share of net expense, or $3.1 million pre-tax ($2.1 million after tax), related to costs associated with acquisitions and divestitures ($0.6 million in COGS and $2.5 million in SG&A)
- Approximately $0.06 per diluted share of net expense, or $34.9 million pre-tax ($25.6 million after tax), related to the early exit of an unfavorable lease contract by purchasing the building (SG&A)
- Approximately $0.01 per diluted share of net benefit, or $4.3 million pre-tax ($2.9 million after tax), related to the substantial liquidation of an international joint venture (Equity method investment earnings)
- Approximately $0.20 per diluted share of net tax expense, or $78.6 million, associated with the termination of the sale agreement for the Wesson oil business which resulted in an increase to the valuation allowance on certain deferred tax assets (Tax)
- Approximately $0.59 per diluted share of net tax benefit, or $236.7 million, for the initial estimated one-time impact of the 2017 Tax Cuts and Jobs Act (Tax)
- Approximately $0.05 per diluted share of net tax expense, or $19.4 million, for unusual tax items, including the indirect tax effect of the recent pension contribution and the effect of a law change in Mexico requiring deconsolidation for tax reporting purposes (Tax)
- Approximately $0.01 per diluted share of beneficial impact due to rounding
Definitions
Organic net sales growth excludes from reported net sales the impacts of foreign exchange, divested businesses and acquisitions, including the Pinnacle acquisition (until the anniversary date of the acquisitions). All references to changes in volume and price/mix throughout this release are on an organic net sales basis.
References to Legacy Conagra throughout this release exclude any income or expenses associated with the recently acquired Pinnacle business.
References to adjusted items throughout this release refer to measures computed in accordance with GAAP less the impact of items impacting comparability. Items impacting comparability are income or expenses (and related tax impacts) that management believes have had, or are likely to have, a significant impact on the earnings of the applicable business segment or on the total corporation for the period in which the item is recognized, and are not indicative of the Company's core operating results. These items thus affect the comparability of underlying results from period to period.
References to earnings before interest, taxes, depreciation, and amortization (EBITDA) refer to net income attributable to Conagra Brands, Inc. before the impacts of discontinued operations, income tax expense (benefit), interest expense, depreciation, and amortization. References to adjusted EBITDA refer to EBITDA before the impacts of items impacting comparability.
References to pro forma items throughout this document refer to historical financial results for Pinnacle Foods prior to completion of the acquisition of Pinnacle Foods by the Company. These items have been adjusted to align with the Company's fiscal calendar and accounting policies to the extent practicable. Comparison to pro forma results allow the Company to discuss and evaluate performance of the Pinnacle segment when a comparable period is not available due to the recency of the acquisition.
Discussion of Results
Conagra Brands will host a webcast and conference call at 9:30 a.m. Eastern time today to discuss the results. The live audio webcast and presentation slides will be available on www.conagrabrands.com/investor-relations under Events & Presentations. The conference call may be accessed by dialing 1-877-883-0383 for participants in the continental U.S. and 1-412-902-6506 for all other participants and using passcode 0722337. Please dial in 10 to 15 minutes prior to the call start time. Following the Company's remarks, the conference call will include a question-and-answer session with the investment community.
A replay of the webcast will be available on www.conagrabrands.com/investor-relations under Events & Presentations until March 21, 2020.
About Conagra Brands
Conagra Brands, Inc. (NYSE: CAG), headquartered in Chicago, is one of North America's leading branded food companies. Guided by an entrepreneurial spirit, Conagra Brands combines a rich heritage of making great food with a sharpened focus on innovation. The company's portfolio is evolving to satisfy people's changing food preferences. Conagra's iconic brands, such as Birds Eye®, Marie Callender's®, Banquet®, Healthy Choice®, Slim Jim®, Reddi-wip®, and Vlasic®, as well as emerging brands, including Angie's® BOOMCHICKAPOP®, Duke's®, Earth Balance®, Gardein®, and Frontera®, offer choices for every occasion. For more information, visit www.conagrabrands.com.
Note on Forward-looking Statements
This document contains forward-looking statements within the meaning of the federal securities laws. These forward-looking statements are based on management's current expectations and are subject to uncertainty and changes in circumstances. Readers of this document should understand that these statements are not guarantees of performance or results. Many factors could affect our actual financial results and cause them to vary materially from the expectations contained in the forward-looking statements, including those set forth in this document. These risks and uncertainties include, among other things: the risk that the cost savings and any other synergies from the acquisition of Pinnacle Foods (the "acquisition") may not be fully realized or may take longer to realize than expected; the risk that the acquisition may not be accretive within the expected timeframe or to the extent anticipated; the risks that the acquisition and related integration will create disruption to Conagra Brands and its management and impede the achievement of business plans; the risk that the acquisition will negatively impact the ability to retain and hire key personnel and maintain relationships with customers, suppliers and other third parties; risks related to Conagra Brands' ability to successfully address Pinnacle Foods' business challenges; risks related to Conagra Brands' ability to achieve the intended benefits of other recent and pending acquisitions and divestitures, including the spin-off of Conagra Brand's Lamb Weston business in the second quarter of fiscal 2017 and the divestiture of Conagra Brand's Wesson oil business in February 2019; risks associated with general economic and industry conditions; risks associated with Conagra Brands' ability to successfully execute its long-term value creation strategies, including those in place for specific brands at Pinnacle Foods before the acquisition; risks related to Conagra Brands' ability to deleverage on currently anticipated timelines, and to continue to access capital on acceptable terms or at all; risks related to Conagra Brands' ability to execute operating and restructuring plans and achieve targeted operating efficiencies from cost-saving initiatives, related to the acquisition and otherwise, and to benefit from trade optimization programs, related to the acquisition and otherwise; risks related to the effectiveness of Conagra Brands' hedging activities and ability to respond to volatility in commodities; risks related to the Company's competitive environment and related market conditions; risks related to Conagra Brands' ability to respond to changing consumer preferences and the success of its innovation and marketing investments; risks related to the ultimate impact of any product recalls and litigation, including litigation related to the lead paint and pigment matters, as well as any securities litigation, including securities class action lawsuits; risk associated with actions of governments and regulatory bodies that affect Conagra Brands' businesses, including the ultimate impact of recently enacted U.S. tax legislation and related regulations or interpretations; risks related to the availability and prices of raw materials, including any negative effects caused by inflation or weather conditions; risks and uncertainties associated with intangible assets, including any future goodwill or intangible assets impairment charges, related to the acquisition or otherwise; the costs, disruption, and diversion of management's attention associated with campaigns commenced by activist investors or due to the integration of the acquisition; and other risks described in Conagra Brands' reports filed from time to time with the Securities and Exchange Commission. We caution readers not to place undue reliance on any forward-looking statements included in this document, which speak only as of the date of this document. We undertake no responsibility to update these statements, except as required by law.
Note on Non-GAAP Financial Measures
This document includes certain non-GAAP financial measures, including adjusted diluted EPS from continuing operations, organic net sales, adjusted gross profit, adjusted operating profit, adjusted gross margin, adjusted SG&A, adjusted corporate expenses, adjusted equity method investment earnings, adjusted operating margin, adjusted effective tax rate and adjusted EBITDA. Management considers GAAP financial measures as well as such non-GAAP financial information in its evaluation of the Company's financial statements and believes these non-GAAP measures provide useful supplemental information to assess the Company's operating performance and financial position. These measures should be viewed in addition to, and not in lieu of, the Company's diluted earnings per share, operating performance and financial measures as calculated in accordance with GAAP.
Certain of these non-GAAP measures, such as organic net sales, adjusted gross margin, adjusted operating margin, adjusted effective tax rate, adjusted net interest expense, and adjusted diluted EPS from continuing operations, are forward-looking. Historically, the Company has excluded the impact of certain items impacting comparability, such as, but not limited to, restructuring expenses, the impact of the extinguishment of debt, the impact of foreign exchange, the impact of acquisitions and divestitures, hedging gains and losses, impairment charges, the impact of legacy legal contingencies, and the impact of unusual tax items, from the non-GAAP financial measures it presents. Reconciliations of these forward-looking non-GAAP financial measures to the most directly comparable GAAP financial measures are not provided because the Company is unable to provide such reconciliations without unreasonable effort, due to the uncertainty and inherent difficulty of predicting the occurrence and the financial impact of such items impacting comparability and the periods in which such items may be recognized. For the same reasons, the Company is unable to address the probable significance of the unavailable information, which could be material to future results.
Hedge gains and losses are generally aggregated, and net amounts are reclassified from unallocated corporate expense to the operating segments when the underlying commodity or foreign currency being hedged is expensed in segment cost of goods sold. The Company identifies these amounts as items that impact comparability within the discussion of unallocated Corporate results.
For more information, please contact:
MEDIA: Mike Cummins
312-549-5257
Michael.Cummins@conagra.com
INVESTORS: Brian Kearney
312-549-5002
IR@conagra.com
Conagra Brands, Inc. | |||||||||||
Consolidated Statements of Earnings | |||||||||||
(in millions) | |||||||||||
(unaudited) | |||||||||||
THIRD QUARTER | |||||||||||
Thirteen weeks | Thirteen weeks | ||||||||||
February 24, 2019 | February 25, 2018 | Percent Change | |||||||||
Net sales | $ | 2,707.1 | $ | 1,994.5 | 35.7 | % | |||||
Costs and expenses: | |||||||||||
Cost of goods sold | 1,954.8 | 1,395.7 | 40.0 | % | |||||||
Selling, general and administrative expenses | 334.1 | 352.1 | (5.1) | % | |||||||
Pension and postretirement non-service income | (9.8) | (21.9) | (55.4) | % | |||||||
Interest expense, net | 130.9 | 39.8 | 228.6 | % | |||||||
Income from continuing operations before income taxes and equity method investment earnings | 297.1 | 228.8 | 29.9 | % | |||||||
Income tax expense (benefit) | 67.2 | (91.4) | N/A | ||||||||
Equity method investment earnings | 12.7 | 29.0 | (56.2) | % | |||||||
Income from continuing operations | 242.6 | 349.2 | (30.5) | % | |||||||
Income from discontinued operations, net of tax | — | 14.5 | (100.0) | % | |||||||
Net income | $ | 242.6 | $ | 363.7 | (33.3) | % | |||||
Less: Net income attributable to noncontrolling interests | 0.6 | 0.9 | (37.4) | % | |||||||
Net income attributable to Conagra Brands, Inc. | $ | 242.0 | $ | 362.8 | (33.3) | % | |||||
Earnings per share - basic | |||||||||||
Income from continuing operations | $ | 0.50 | $ | 0.87 | (42.5) | % | |||||
Income from discontinued operations | — | 0.04 | (100.0) | % | |||||||
Net income attributable to Conagra Brands, Inc. | $ | 0.50 | $ | 0.91 | (45.1) | % | |||||
Weighted average shares outstanding | 486.2 | 399.1 | 21.8 | % | |||||||
Earnings per share - diluted | |||||||||||
Income from continuing operations | $ | 0.50 | $ | 0.87 | (42.5) | % | |||||
Income from discontinued operations | — | 0.03 | (100.0) | % | |||||||
Net income attributable to Conagra Brands, Inc. | $ | 0.50 | $ | 0.90 | (44.4) | % | |||||
Weighted average share and share equivalents outstanding | 487.4 | 402.5 | 21.1 | % | |||||||
Conagra Brands, Inc. | |||||||||||
Consolidated Statements of Earnings | |||||||||||
(in millions) | |||||||||||
(unaudited) | |||||||||||
THIRD QUARTER | |||||||||||
Thirty-nine weeks | Thirty-nine weeks | ||||||||||
February 24, 2019 | February 25, 2018 | Percent Change | |||||||||
Net sales | $ | 6,925.2 | $ | 5,972.1 | 16.0 | % | |||||
Costs and expenses: | |||||||||||
Cost of goods sold | 4,980.2 | 4,196.0 | 18.7 | % | |||||||
Selling, general and administrative expenses | 1,078.7 | 936.5 | 15.2 | % | |||||||
Pension and postretirement non-service income | (29.7) | (60.0) | (50.5) | % | |||||||
Interest expense, net | 260.5 | 114.2 | 128.1 | % | |||||||
Income from continuing operations before income taxes and equity method investment earnings | 635.5 | 785.4 | (19.1) | % | |||||||
Income tax expense | 147.0 | 138.1 | 6.5 | % | |||||||
Equity method investment earnings | 66.6 | 79.6 | (16.2) | % | |||||||
Income from continuing operations | 555.1 | 726.9 | (23.6) | % | |||||||
Income (loss) from discontinued operations, net of tax | (1.9) | 14.6 | N/A | ||||||||
Net income | $ | 553.2 | $ | 741.5 | (25.4) | % | |||||
Less: Net income attributable to noncontrolling interests | 1.4 | 2.7 | (49.0) | % | |||||||
Net income attributable to Conagra Brands, Inc. | $ | 551.8 | $ | 738.8 | (25.3) | % | |||||
Earnings per share - basic | |||||||||||
Income from continuing operations | $ | 1.28 | $ | 1.78 | (28.1) | % | |||||
Income from discontinued operations | — | 0.03 | (100.0) | % | |||||||
Net income attributable to Conagra Brands, Inc. | $ | 1.28 | $ | 1.81 | (29.3) | % | |||||
Weighted average shares outstanding | 431.3 | 407.3 | 5.9 | % | |||||||
Earnings per share - diluted | |||||||||||
Income from continuing operations | $ | 1.28 | $ | 1.76 | (27.3) | % | |||||
Income (loss) from discontinued operations | (0.01) | 0.04 | N/A | ||||||||
Net income attributable to Conagra Brands, Inc. | $ | 1.27 | $ | 1.80 | (29.4) | % | |||||
Weighted average share and share equivalents outstanding | 433.1 | 411.1 | 5.3 | % | |||||||
Conagra Brands, Inc. Consolidated Balance Sheets (in millions) (unaudited) | ||||||||
February 24, 2019 | May 27, 2018 | |||||||
ASSETS | ||||||||
Current assets | ||||||||
Cash and cash equivalents | $ | 282.2 | $ | 128.0 | ||||
Receivables, less allowance for doubtful accounts | ||||||||
of $3.1 and $1.7 | 870.2 | 569.4 | ||||||
Inventories | 1,638.6 | 988.7 | ||||||
Prepaid expenses and other current assets | 107.6 | 184.9 | ||||||
Current assets held for sale | 47.5 | 67.9 | ||||||
Total current assets | 2,946.1 | 1,938.9 | ||||||
Property, plant and equipment, net | 2,358.6 | 1,589.5 | ||||||
Goodwill | 11,349.8 | 4,487.4 | ||||||
Brands, trademarks and other intangibles, net | 4,962.0 | 1,282.8 | ||||||
Other assets | 951.0 | 906.3 | ||||||
Noncurrent assets held for sale | 159.1 | 184.6 | ||||||
$ | 22,726.6 | $ | 10,389.5 | |||||
LIABILITIES AND STOCKHOLDERS' EQUITY | ||||||||
Current liabilities | ||||||||
Notes payable | $ | — | $ | 277.3 | ||||
Current installments of long-term debt | 19.9 | 307.0 | ||||||
Accounts payable | 1,189.2 | 905.3 | ||||||
Accrued payroll | 166.9 | 161.7 | ||||||
Other accrued liabilities | 851.8 | 671.0 | ||||||
Current liabilities held for sale | 13.9 | 13.9 | ||||||
Total current liabilities | 2,241.7 | 2,336.2 | ||||||
Senior long-term debt, excluding current installments | 10,911.8 | 3,035.6 | ||||||
Subordinated debt | 195.9 | 195.9 | ||||||
Other noncurrent liabilities | 1,918.8 | 1,060.8 | ||||||
Noncurrent liabilities held for sale | 6.9 | 4.4 | ||||||
Total stockholders' equity | 7,451.5 | 3,756.6 | ||||||
$ | 22,726.6 | $ | 10,389.5 | |||||
Conagra Brands, Inc. | |||||||
Condensed Consolidated Statements of Cash Flows | |||||||
(in millions) | |||||||
(unaudited) | |||||||
Thirty-nine weeks ended | |||||||
February 24, 2019 | February 25, 2018 | ||||||
Cash flows from operating activities: | |||||||
Net income | $ | 553.2 | $ | 741.5 | |||
Income (loss) from discontinued operations | (1.9) | 14.6 | |||||
Income from continuing operations | 555.1 | 726.9 | |||||
Adjustments to reconcile income from continuing operations to net cash flows from operating activities: | |||||||
Depreciation and amortization | 232.6 | 193.4 | |||||
Asset impairment charges | 3.0 | 9.4 | |||||
Gain on divestiture | (13.2) | — | |||||
Earnings of affiliates in excess of distributions | (23.4) | (53.1) | |||||
Stock-settled share-based payments expense | 22.5 | 26.7 | |||||
Contributions to pension plans | (11.5) | (9.7) | |||||
Pension benefit | (21.0) | (38.7) | |||||
Lease cancellation expense | — | 48.2 | |||||
Proceeds from settlement of interest rate swaps | 47.5 | — | |||||
Novation of a legacy guarantee | (27.3) | — | |||||
Other items | 25.4 | (31.0) | |||||
Change in operating assets and liabilities excluding effects of business acquisitions and dispositions: | |||||||
Receivables | (108.4) | (25.8) | |||||
Inventories | 13.0 | (89.8) | |||||
Deferred income taxes and income taxes payable, net | 39.3 | (10.2) | |||||
Prepaid expenses and other current assets | (20.0) | (5.5) | |||||
Accounts payable | (15.6) | 101.2 | |||||
Accrued payroll | (9.0) | (30.9) | |||||
Other accrued liabilities | 56.1 | (3.0) | |||||
Net cash flows from operating activities —continuing operations | 745.1 | 808.1 | |||||
Net cash flows from operating activities — discontinued operations | 11.2 | 34.2 | |||||
Net cash flows from operating activities | 756.3 | 842.3 | |||||
Cash flows from investing activities: | |||||||
Additions to property, plant and equipment | (236.1) | (175.9) | |||||
Sale of property, plant and equipment | 18.7 | 7.5 | |||||
Purchase of businesses, net of cash acquired | (5,119.2) | (337.1) | |||||
Proceeds from divestiture | 32.2 | — | |||||
Other items | 0.1 | 4.3 | |||||
Net cash flows from investing activities | (5,304.3) | (501.2) | |||||
Cash flows from financing activities: | |||||||
Net short-term borrowings | (278.3) | 324.1 | |||||
Issuance of long-term debt | 8,310.5 | 500.0 | |||||
Repayment of long-term debt | (3,517.1) | (170.1) | |||||
Debt issuance costs and bridge financing fees | (95.2) | (2.9) | |||||
Payment of intangible asset financing arrangement | (14.0) | (14.4) | |||||
Issuance of Conagra Brands, Inc. common shares, net | 555.7 | — | |||||
Repurchase of Conagra Brands, Inc. common shares | — | (860.0) | |||||
Cash dividends paid | (253.0) | (257.7) | |||||
Exercise of stock options and issuance of other stock awards, including tax withholdings | (4.1) | 13.0 | |||||
Other items | 0.9 | — | |||||
Net cash flows from financing activities | 4,705.4 | (468.0) | |||||
Effect of exchange rate changes on cash and cash equivalents and restricted cash | (3.2) | 8.4 | |||||
Net change in cash and cash equivalents and restricted cash | 154.2 | (118.5) | |||||
Cash and cash equivalents and restricted cash at beginning of period | 129.0 | 252.4 | |||||
Cash and cash equivalents and restricted cash at end of period | $ | 283.2 | $ | 133.9 | |||
Conagra Brands, Inc. | ||||||||||||||||||||
Reconciliation of Non-GAAP Financial Measures to Reported Financial Measures | ||||||||||||||||||||
(in millions) | ||||||||||||||||||||
Q3 FY19 | Grocery & | Refrigerated & | International | Foodservice | Pinnacle | Total Conagra | ||||||||||||||
Net Sales | $ | 862.6 | $ | 711.2 | $ | 198.0 | $ | 223.0 | $ | 712.3 | $ | 2,707.1 | ||||||||
Impact of foreign exchange | — | — | 9.3 | — | — | 9.3 | ||||||||||||||
Net sales from acquired businesses | — | (6.1) | — | — | (712.3) | (718.4) | ||||||||||||||
Organic Net Sales ex Trenton | $ | 862.6 | $ | 705.1 | $ | 207.3 | $ | 223.0 | $ | — | $ | 1,998.0 | ||||||||
Year-over-year change - Net Sales | 2.9 | % | 3.3 | % | (11.4) | % | (8.7) | % | 100.0 | % | 35.7 | % | ||||||||
Impact of foreign exchange (pp) | — | — | 4.1 | — | — | 0.5 | ||||||||||||||
Net sales from acquired businesses (pp) | — | (0.9) | — | — | (100.0) | (36.0) | ||||||||||||||
Net sales from divested businesses (pp) | — | — | 6.4 | — | — | 0.7 | ||||||||||||||
Net sales from sold Trenton plant (pp) | — | — | — | 8.1 | — | 1.0 | ||||||||||||||
Organic Net Sales ex Trenton Growth | 2.9 | % | 2.4 | % | (0.9) | % | (0.6) | % | — | % | 1.9 | % | ||||||||
Volume (Organic) | 2.1 | % | 3.5 | % | (2.0) | % | (6.7) | % | — | % | 1.2 | % | ||||||||
Price/Mix | 0.8 | % | (1.1) | % | 1.1 | % | 6.1 | % | — | % | 0.7 | % | ||||||||
Q3 FY18 | Grocery & | Refrigerated & Frozen | International | Foodservice | Pinnacle | Total Conagra | ||||||||||||||
Net Sales | $ | 838.3 | $ | 688.5 | $ | 223.4 | $ | 244.3 | $ | — | $ | 1,994.5 | ||||||||
Net sales from divested businesses | — | — | (14.5) | — | — | (14.5) | ||||||||||||||
Net sales from sold Trenton plant | — | — | — | (19.8) | — | (19.8) | ||||||||||||||
Organic Net Sales ex Trenton | $ | 838.3 | $ | 688.5 | $ | 208.9 | $ | 224.5 | $ | — | $ | 1,960.2 | ||||||||
Q3 FY19 YTD | Grocery & | Refrigerated & Frozen | International | Foodservice | Pinnacle | Total Conagra | ||||||||||||||
Net Sales | $ | 2,533.4 | $ | 2,117.3 | $ | 600.1 | $ | 703.3 | $ | 971.1 | $ | 6,925.2 | ||||||||
Impact of foreign exchange | — | — | 24.3 | — | — | 24.3 | ||||||||||||||
Net sales from acquired businesses | (41.3) | (25.7) | (3.7) | — | (971.1) | (1,041.8) | ||||||||||||||
Net sales from divested businesses | — | — | (4.1) | — | — | (4.1) | ||||||||||||||
Net sales from sold Trenton plant | — | — | — | (2.0) | — | (2.0) | ||||||||||||||
Organic Net Sales ex Trenton | $ | 2,492.1 | $ | 2,091.6 | $ | 616.6 | $ | 701.3 | $ | — | $ | 5,901.6 | ||||||||
Year-over-year change - Net Sales | 2.0 | % | 2.7 | % | (5.5) | % | (11.0) | % | 100.0 | % | 16.0 | % | ||||||||
Impact of foreign exchange (pp) | — | — | 4.0 | — | — | 0.3 | ||||||||||||||
Net sales from acquired businesses (pp) | (1.7) | (1.3) | (0.6) | — | (100.0) | (17.4) | ||||||||||||||
Net sales from divested businesses (pp) | — | — | 5.0 | — | — | 0.5 | ||||||||||||||
Net sales from sold Trenton plant (pp) | — | — | — | 6.9 | — | 1.0 | ||||||||||||||
Organic Net Sales ex Trenton Growth | 0.3 | % | 1.4 | % | 2.9 | % | (4.1) | % | — | % | 0.4 | % | ||||||||
Volume (Organic) | (0.1) | % | 1.5 | % | 0.9 | % | (8.4) | % | — | % | (0.4) | % | ||||||||
Price/Mix | 0.4 | % | (0.1) | % | 2.0 | % | 4.3 | % | — | % | 0.8 | % | ||||||||
Q3 FY18 YTD | Grocery & | Refrigerated & Frozen | International | Foodservice | Pinnacle | Total Conagra | ||||||||||||||
Net Sales | $ | 2,484.5 | $ | 2,062.3 | $ | 634.6 | $ | 790.7 | $ | — | $ | 5,972.1 | ||||||||
Net sales from divested businesses | — | — | (35.8) | — | — | (35.8) | ||||||||||||||
Net sales from sold Trenton plant | — | — | — | (59.6) | — | (59.6) | ||||||||||||||
Organic Net Sales ex Trenton | $ | 2,484.5 | $ | 2,062.3 | $ | 598.8 | $ | 731.1 | $ | — | $ | 5,876.7 | ||||||||
Conagra Brands, Inc. | |||||||||||||||||||||
Reconciliation of Non-GAAP Financial Measures to Reported Financial Measures | |||||||||||||||||||||
(in millions) | |||||||||||||||||||||
Q3 FY19 | Grocery & | Refrigerated | International | Foodservice | Pinnacle | Corporate | Total | ||||||||||||||
Operating Profit | $ | 193.5 | $ | 131.4 | $ | 25.1 | $ | 29.2 | $ | 101.6 | $ | (62.6) | $ | 418.2 | |||||||
Restructuring plans | 2.0 | 0.9 | 0.7 | — | 1.4 | 33.4 | 38.4 | ||||||||||||||
Acquisitions and divestitures | 0.1 | — | — | — | — | 2.3 | 2.4 | ||||||||||||||
Inventory fair value mark-up rollout | — | — | — | — | 26.9 | — | 26.9 | ||||||||||||||
Novation of a legacy guarantee | — | — | — | — | — | (27.3) | (27.3) | ||||||||||||||
Fair value adjustment of cash settleable equity awards issued in connection with Pinnacle acquisition | — | — | — | — | — | (18.6) | (18.6) | ||||||||||||||
Corporate hedging derivative losses (gains) | — | — | — | — | — | 0.2 | 0.2 | ||||||||||||||
Adjusted Operating Profit | $ | 195.6 | $ | 132.3 | $ | 25.8 | $ | 29.2 | $ | 129.9 | $ | (72.6) | $ | 440.2 | |||||||
Operating Profit Margin | 22.4 | % | 18.5 | % | 12.7 | % | 13.1 | % | 14.3 | % | 15.4 | % | |||||||||
Adjusted Operating Profit Margin | 22.7 | % | 18.6 | % | 13.0 | % | 13.1 | % | 18.2 | % | 16.3 | % | |||||||||
Year-over-year % change - Operating Profit | 10.2 | % | 4.2 | % | (15.0) | % | 21.5 | % | 100.0 | % | (42.3)% | 69.5 | % | ||||||||
Year-over year % change - Adjusted Operating Profit | 9.8 | % | 4.2 | % | (13.0) | % | 21.5 | % | 100.0 | % | 20.3% | 47.5 | % | ||||||||
Year-over-year bps change - Adjusted Operating Profit | 142 bps | 17 bps | (24) bps | 326 bps | N/A | 130 bps | |||||||||||||||
Q3 FY18 | Grocery & Snacks | Refrigerated | International | Foodservice | Pinnacle | Corporate Expense | Total | ||||||||||||||
Operating Profit | $ | 175.6 | $ | 126.1 | $ | 29.5 | $ | 24.0 | $ | — | $ | (108.5) | $ | 246.7 | |||||||
Restructuring plans | 0.4 | 0.1 | 0.2 | — | — | 14.0 | 14.7 | ||||||||||||||
Acquisitions and divestitures | 2.4 | 0.7 | — | — | — | — | 3.1 | ||||||||||||||
Corporate hedging derivative losses (gains) | — | — | — | — | — | (0.8) | (0.8) | ||||||||||||||
Early exit of an unfavorable lease contract by purchasing the building | — | — | — | — | — | 34.9 | 34.9 | ||||||||||||||
Adjusted Operating Profit | $ | 178.4 | $ | 126.9 | $ | 29.7 | $ | 24.0 | $ | — | $ | (60.4) | $ | 298.6 | |||||||
Operating Profit Margin | 20.9 | % | 18.3 | % | 13.2 | % | 9.8 | % | — | % | 12.4 | % | |||||||||
Adjusted Operating Profit Margin | 21.3 | % | 18.4 | % | 13.3 | % | 9.8 | % | — | % | 15.0 | % | |||||||||
Conagra Brands, Inc. | |||||||||||||||||||||
Reconciliation of Non-GAAP Financial Measures to Reported Financial Measures | |||||||||||||||||||||
(in millions) | |||||||||||||||||||||
Q3 FY19 YTD | Grocery & | Refrigerated | International | Foodservice | Pinnacle | Corporate | Total | ||||||||||||||
Operating Profit | $ | 581.2 | $ | 365.0 | $ | 87.2 | $ | 89.4 | $ | 130.3 | $ | (386.8) | $ | 866.3 | |||||||
Restructuring plans | 4.2 | 1.0 | 0.9 | — | 5.2 | 139.2 | 150.5 | ||||||||||||||
Gain on sale of Del Monte business | — | — | (13.2) | — | — | — | (13.2) | ||||||||||||||
Acquisitions and divestitures | 1.0 | — | 2.9 | — | — | 100.0 | 103.9 | ||||||||||||||
Integration costs | — | — | — | — | — | 8.9 | 8.9 | ||||||||||||||
Inventory fair value mark-up rollout | — | — | — | — | 51.3 | — | 51.3 | ||||||||||||||
Novation of a legacy guarantee | — | — | — | — | — | (27.3) | (27.3) | ||||||||||||||
Fair value adjustment of cash settleable equity awards issued in connection with Pinnacle acquisition | — | — | — | — | — | (18.6) | (18.6) | ||||||||||||||
Corporate hedging derivative losses (gains) | — | — | — | — | — | 3.8 | 3.8 | ||||||||||||||
Adjusted Operating Profit | $ | 586.4 | $ | 366.0 | $ | 77.8 | $ | 89.4 | $ | 186.8 | $ | (180.8) | $ | 1,125.6 | |||||||
Operating Profit Margin | 22.9 | % | 17.2 | % | 14.5 | % | 12.7 | % | 13.4 | % | 12.5 | % | |||||||||
Adjusted Operating Profit Margin | 23.2 | % | 17.3 | % | 13.0 | % | 12.7 | % | 19.2 | % | 16.3 | % | |||||||||
Year-over-year % change - Operating Profit | 5.4 | % | 2.4 | % | 27.1 | % | (5.6) | % | 100.0 | % | 67.0% | 3.2 | % | ||||||||
Year-over year % change - Adjusted Operating Profit | 2.3 | % | 2.5 | % | 11.7 | % | (5.6) | % | 100.0 | % | 2.1% | 22.7 | % | ||||||||
Year-over-year bps change - Adjusted Operating Profit | 8 bps | (3) bps | 199 bps | 74 bps | N/A | 0 bps | 89 bps | ||||||||||||||
Q3 FY18 YTD | Grocery & Snacks | Refrigerated | International | Foodservice | Pinnacle Foods | Corporate Expense | Total | ||||||||||||||
Operating Profit | $ | 551.6 | $ | 356.5 | $ | 68.6 | $ | 94.6 | $ | — | $ | (231.7) | $ | 839.6 | |||||||
Restructuring plans | 10.6 | 0.1 | 1.1 | — | — | 21.4 | 33.2 | ||||||||||||||
Acquisitions and divestitures | 11.0 | 0.7 | — | — | — | — | 11.7 | ||||||||||||||
Corporate hedging derivative losses (gains) | — | — | — | — | — | (1.9) | (1.9) | ||||||||||||||
Early exit of an unfavorable lease contract by purchasing the building | — | — | — | — | — | 34.9 | 34.9 | ||||||||||||||
Adjusted Operating Profit | $ | 573.2 | $ | 357.3 | $ | 69.7 | $ | 94.6 | $ | — | $ | (177.3) | $ | 917.5 | |||||||
Operating Profit Margin | 22.2 | % | 17.3 | % | 10.8 | % | 12.0 | % | — | % | 14.1 | % | |||||||||
Adjusted Operating Profit Margin | 23.1 | % | 17.3 | % | 11.0 | % | 12.0 | % | — | % | 15.4 | % | |||||||||
Conagra Brands, Inc. | |||||||||||||||||||||||
Reconciliation of Non-GAAP Financial Measures to Reported Financial Measures | |||||||||||||||||||||||
(in millions) | |||||||||||||||||||||||
Q3 FY19 | Gross profit | Selling, | Operating profit 1 | Income from | Income | Income | Net income | Diluted EPS from | |||||||||||||||
Reported | $ | 752.3 | $ | 334.1 | $ | 418.2 | $ | 297.1 | $ | 67.2 | 21.7% | $ | 242.0 | $ | 0.50 | ||||||||
% of Net Sales | 27.8 | % | 12.3 | % | 15.4 | % | |||||||||||||||||
Restructuring plans | 1.9 | 36.5 | 38.4 | 38.4 | 9.7 | 28.7 | 0.06 | ||||||||||||||||
Acquisitions and divestitures | — | 2.4 | 2.4 | 2.4 | 0.5 | 1.9 | — | ||||||||||||||||
Corporate hedging derivative losses (gains) | 0.2 | — | 0.2 | 0.2 | — | 0.2 | — | ||||||||||||||||
Advertising and promotion expenses 2 | — | 67.4 | — | — | — | — | — | ||||||||||||||||
Inventory fair value mark-up rollout | 26.9 | — | 26.9 | 26.9 | 6.9 | 20.0 | 0.04 | ||||||||||||||||
Novation of a legacy guarantee | — | (27.3) | (27.3) | (27.3) | — | (27.3) | (0.06) | ||||||||||||||||
Fair value adjustment of cash settleable equity awards issued in connection with Pinnacle acquisition | — | (18.6) | (18.6) | (18.6) | (1.1) | (17.5) | (0.04) | ||||||||||||||||
Unusual tax items | — | — | — | — | (2.5) | 2.5 | 0.01 | ||||||||||||||||
Adjusted | $ | 781.3 | $ | 273.7 | $ | 440.2 | $ | 319.1 | $ | 80.7 | 24.3% | $ | 250.5 | $ | 0.51 | ||||||||
% of Net Sales (margin) | 28.9 | % | 10.1 | % | 16.3 | % | |||||||||||||||||
Year-over-year % of net sales change - reported | (223) bps | (531) bps | 308 bps | ||||||||||||||||||||
Year-over-year % of net sales change - adjusted | (115) bps | (101) bps | 130 bps | ||||||||||||||||||||
Year-over-year change - reported | 25.6 | % | (5.1) | % | 69.5 | % | 29.9 | % | N/A | (33.3) | % | (42.5) | % | ||||||||||
Year-over-year change - adjusted | 30.5 | % | 23.4 | % | 47.5 | % | 13.7 | % | 34.7 | % | 2.5 | % | (16.4) | % | |||||||||
Q3 FY18 | Gross profit | Selling, | Operating profit 1 | Income from continuing operations before income taxes and equity method investment earnings | Income | Income tax rate | Net income attributable | Diluted EPS from income from continuing operations attributable to Conagra Brands, Inc common stockholders | |||||||||||||||
Reported | $ | 598.8 | $ | 352.1 | $ | 246.7 | $ | 228.8 | $ | (91.4) | (35.5)% | $ | 362.8 | $ | 0.87 | ||||||||
% of Net Sales | 30.0 | % | 17.7 | % | 12.4 | % | |||||||||||||||||
Restructuring plans | (0.1) | 14.8 | 14.7 | 14.7 | 3.9 | 10.8 | 0.03 | ||||||||||||||||
Acquisitions and divestitures | 0.6 | 2.5 | 3.1 | 3.1 | 1.0 | 2.1 | 0.01 | ||||||||||||||||
Corporate hedging derivative losses (gains) | (0.8) | — | (0.8) | (0.8) | (0.2) | (0.6) | — | ||||||||||||||||
Early exit of an unfavorable lease contract by purchasing the building | — | 34.9 | 34.9 | 34.9 | 9.3 | 25.6 | 0.06 | ||||||||||||||||
Gain on substantial liquidation of an international joint venture | — | — | — | — | (1.4) | (2.9) | (0.01) | ||||||||||||||||
Advertising and promotion expenses 2 | — | 78.2 | — | — | — | — | — | ||||||||||||||||
Wesson valuation allowance adjustment | — | — | — | — | (78.6) | 78.6 | 0.20 | ||||||||||||||||
Tax reform adjustments | — | — | — | — | 236.7 | (236.7) | (0.59) | ||||||||||||||||
Unusual tax items | — | — | — | — | (19.4) | 19.4 | 0.05 | ||||||||||||||||
Income from discontinued operations, net of noncontrolling interests | — | — | — | — | — | (14.5) | — | ||||||||||||||||
Rounding | — | — | — | — | — | — | (0.01) | ||||||||||||||||
Adjusted | $ | 598.5 | $ | 221.7 | $ | 298.6 | $ | 280.7 | $ | 59.9 | 19.7% | $ | 244.6 | $ | 0.61 | ||||||||
% of Net Sales (margin) | 30.0 | % | 11.1 | % | 15.0 | % | |||||||||||||||||
1 Operating profit is derived from taking Income from continuing operations before income taxes and equity method investment earnings, adding back Interest expense, net and removing Pension and postretirement non-service income. |
2 Advertising and promotion expense (A&P) has been removed from adjusted selling, general and administrative expense because this metric is used in reporting to management, and management believes this adjusted measure provides useful supplemental information to assess the Company's operating performance. Please note that A&P is not removed from adjusted profit measures. |
Conagra Brands, Inc. | |||||||||||||||||||||||
Reconciliation of Non-GAAP Financial Measures to Reported Financial Measures | |||||||||||||||||||||||
(in millions) | |||||||||||||||||||||||
Q3 FY19 YTD | Gross profit | Selling, | Operating profit 1 | Income from | Income | Income | Net income | Diluted EPS from | |||||||||||||||
Reported | $ | 1,945.0 | $ | 1,078.7 | $ | 866.3 | $ | 635.5 | $ | 147.0 | 20.9% | $ | 551.8 | $ | 1.28 | ||||||||
% of Net Sales | 28.1 | % | 15.6 | % | 12.5 | % | |||||||||||||||||
Restructuring plans | 9.8 | 140.7 | 150.5 | 149.9 | 34.2 | 115.7 | 0.27 | ||||||||||||||||
Acquisitions and divestitures | — | 103.9 | 103.9 | 115.8 | 22.9 | 92.9 | 0.21 | ||||||||||||||||
Integration costs | — | 8.9 | 8.9 | 8.9 | 2.3 | 6.6 | 0.02 | ||||||||||||||||
Corporate hedging derivative losses (gains) | 3.8 | — | 3.8 | 3.8 | 0.9 | 2.9 | 0.01 | ||||||||||||||||
Advertising and promotion expenses 2 | — | 179.5 | — | — | — | — | — | ||||||||||||||||
Inventory fair value mark-up rollout | 51.3 | — | 51.3 | 51.3 | 13.1 | 38.2 | 0.09 | ||||||||||||||||
Novation of a legacy guarantee | — | (27.3) | (27.3) | (27.3) | — | (27.3) | (0.06) | ||||||||||||||||
Fair value adjustment of cash settleable equity awards issued in connection with Pinnacle acquisition | — | (18.6) | (18.6) | (18.6) | (1.1) | (17.5) | (0.04) | ||||||||||||||||
Gain on sale of Del Monte business | — | (13.2) | (13.2) | (13.2) | (3.6) | (9.6) | (0.02) | ||||||||||||||||
Gain on Ardent JV asset sale | — | — | — | — | (3.5) | (11.6) | (0.03) | ||||||||||||||||
Wesson valuation allowance adjustment | — | — | — | — | 24.3 | (24.3) | (0.06) | ||||||||||||||||
Unusual tax items | — | — | — | — | 0.1 | (0.1) | — | ||||||||||||||||
Loss from discontinued operations, net of noncontrolling interests | — | — | — | — | — | 1.9 | — | ||||||||||||||||
Rounding | — | — | — | — | — | — | (0.01) | ||||||||||||||||
Adjusted | $ | 2,009.9 | $ | 704.8 | $ | 1,125.6 | $ | 906.1 | $ | 236.6 | 24.7% | $ | 719.6 | $ | 1.66 | ||||||||
% of Net Sales (margin) | 29.0 | % | 10.2 | % | 16.3 | % | |||||||||||||||||
Year-over-year % of net sales change - reported | (165) bps | (10) bps | (155) bps | ||||||||||||||||||||
Year-over-year % of net sales change - adjusted | (79) bps | (61) bps | 89 bps | ||||||||||||||||||||
Year-over-year change - reported | 9.5 | % | 15.2 | % | 3.2 | % | (19.1) | % | 6.5 | % | (25.3) | % | (27.3) | % | |||||||||
Year-over-year change - adjusted | 12.9 | % | 9.4 | % | 22.7 | % | 4.5 | % | (14.8) | % | 8.7 | % | 3.1 | % | |||||||||
Q3 FY18 YTD | Gross profit | Selling, | Operating profit 1 | Income from | Income | Income tax rate | Net income attributable | Diluted EPS from income from continuing operations attributable to Conagra Brands, Inc common stockholders | |||||||||||||||
Reported | $ | 1,776.1 | $ | 936.5 | $ | 839.6 | $ | 785.4 | $ | 138.1 | 16.0% | $ | 738.8 | $ | 1.76 | ||||||||
% of Net Sales | 29.7 | % | 15.7 | % | 14.1 | % | |||||||||||||||||
Restructuring plans | 5.6 | 27.6 | 33.2 | 33.2 | 10.5 | 22.7 | 0.06 | ||||||||||||||||
Acquisitions and divestitures | 0.6 | 11.1 | 11.7 | 11.7 | 4.1 | 7.6 | 0.02 | ||||||||||||||||
Corporate hedging derivative losses (gains) | (1.9) | — | (1.9) | (1.9) | (0.6) | (1.3) | — | ||||||||||||||||
Pension settlement and valuation adjustment | — | — | — | 4.1 | 1.6 | 2.5 | 0.01 | ||||||||||||||||
Early exit of an unfavorable lease contract by purchasing the building | — | 34.9 | 34.9 | 34.9 | 9.3 | 25.6 | 0.06 | ||||||||||||||||
Gain on substantial liquidation of an international joint venture | — | — | — | — | (1.4) | (2.9) | (0.01) | ||||||||||||||||
Advertising and promotion expenses 2 | — | 219.1 | — | — | — | — | — | ||||||||||||||||
Wesson valuation allowance adjustment | — | — | — | — | (78.6) | 78.6 | 0.19 | ||||||||||||||||
Tax reform adjustments | — | — | — | — | 236.7 | (236.7) | (0.58) | ||||||||||||||||
Unusual tax items | — | — | — | — | (41.9) | 41.9 | 0.10 | ||||||||||||||||
Income from discontinued operations, net of noncontrolling interests | — | — | — | — | — | (14.6) | — | ||||||||||||||||
Adjusted | $ | 1,780.4 | $ | 643.8 | $ | 917.5 | $ | 867.4 | $ | 277.8 | 29.5% | $ | 662.2 | $ | 1.61 | ||||||||
% of Net Sales (margin) | 29.8 | % | 10.8 | % | 15.4 | % | |||||||||||||||||
1 Operating profit is derived from taking Income from continuing operations before income taxes and equity method investment earnings, adding back Interest expense, net and removing Pension and postretirement non-service income. |
2 Advertising and promotion expense (A&P) has been removed from adjusted selling, general and administrative expense because this metric is used in reporting to management, and management believes this adjusted measure provides useful supplemental information to assess the Company's operating performance. Please note that A&P is not removed from adjusted profit measures. |
Conagra Brands, Inc. | |||||||||
Reconciliation of Non-GAAP Financial Measures to Reported Financial Measures | |||||||||
(in millions) | |||||||||
Q3 FY19 | Q3 FY18 | % Change | |||||||
Net income attributable to Conagra Brands, Inc. | $ | 242.0 | $ | 362.8 | (33.3) | % | |||
Less: | Income from discontinued operations, net of tax | — | 14.5 | ||||||
Add Back: | Income tax expense (benefit) | 67.2 | (91.4) | ||||||
Income tax expense attributable to noncontrolling interests | (0.2) | (0.4) | |||||||
Interest expense, net | 130.9 | 39.8 | |||||||
Depreciation | 77.4 | 55.5 | |||||||
Amortization | 14.9 | 8.9 | |||||||
Earnings before interest, taxes, depreciation, and amortization | $ | 532.2 | $ | 360.7 | 47.5 | % | |||
Restructuring plans 1 | 38.6 | 14.5 | |||||||
Acquisitions and divestitures | 2.4 | 3.1 | |||||||
Corporate hedging losses (gains) | 0.2 | (0.8) | |||||||
Inventory fair value mark-up rollout | 26.9 | — | |||||||
Novation of a legacy guarantee | (27.3) | — | |||||||
Fair value adjustment of cash settleable equity awards issued in connection with Pinnacle acquisition | (18.6) | — | |||||||
Early exit of an unfavorable lease contract by purchasing the building | — | 34.9 | |||||||
Gain on substantial liquidation of an international joint venture | — | (4.3) | |||||||
Adjusted Earnings before interest, taxes, depreciation, and amortization | $ | 554.4 | $ | 408.1 | 35.9 | % | |||
1 Excludes comparability items related to depreciation. |
Q3 FY19 | Q3 FY18 | % Change | |||||||
Equity method investment earnings | $ | 12.7 | $ | 29.0 | (56.2) | % | |||
Gain on substantial liquidation of an international joint venture | — | (4.3) | |||||||
Adjusted equity method investment earnings | $ | 12.7 | $ | 24.7 | (48.6) | % | |||
Q3 FY19 | Legacy Conagra | Legacy Pinnacle | Total Conagra | ||||||
Net Sales | $ | 1,994.8 | $ | 712.3 | $ | 2,707.1 | |||
Gross Profit | 592.9 | 159.4 | 752.3 | ||||||
Restructuring plans | 1.9 | — | 1.9 | ||||||
Corporate hedging losses | 0.2 | — | 0.2 | ||||||
Inventory fair value mark-up rollout | — | 26.9 | 26.9 | ||||||
Adjusted Gross Profit | $ | 595.0 | $ | 186.3 | $ | 781.3 | |||
Gross Margin | 29.7 | % | 22.4 | % | 27.8 | % | |||
Adjusted Gross Margin | 29.8 | % | 26.2 | % | 28.9 | % | |||
Conagra Brands, Inc. | ||||||||
Reconciliation of Non-GAAP Financial Measures to Reported Financial Measures | ||||||||
(in millions) | ||||||||
Q3 FY19 | Q3 FY18 | % Change | ||||||
Net Sales | $ | 2,707.1 | $ | 1,994.5 | 35.7 | % | ||
Impact of foreign exchange | 9.3 | — | ||||||
Net sales from acquired businesses | (718.4) | — | ||||||
Net sales from divested businesses | — | (14.5) | ||||||
Net sales from sold Trenton plant | — | (19.8) | ||||||
Organic Net Sales ex Trenton | $ | 1,998.0 | $ | 1,960.2 | 1.9 | % | ||
Net sales from Wesson oil business | (55.3) | (52.2) | ||||||
Organic Net Sales ex Trenton ex Wesson | $ | 1,942.7 | $ | 1,908.0 | 1.8 | % | ||
Q3 FY19 YTD | Q3 FY18 YTD | % Change | ||||||
Net Sales | $ | 6,925.2 | $ | 5,972.1 | 16.0 | % | ||
Impact of foreign exchange | 24.3 | — | ||||||
Net sales from acquired businesses | (1,041.8) | — | ||||||
Net sales from divested businesses | (4.1) | (35.8) | ||||||
Net sales from sold Trenton plant | (2.0) | (59.6) | ||||||
Organic Net Sales ex Trenton | $ | 5,901.6 | $ | 5,876.7 | 0.4 | % | ||
Net sales from Wesson oil business | (167.2) | (177.1) | ||||||
Organic Net Sales ex Trenton ex Wesson | $ | 5,734.4 | $ | 5,699.6 | 0.6 | % | ||
![]()
SOURCE Conagra Brands, Inc.

Conagra Brands Announces Quarterly Dividend Payment
Conagra Brands, Inc. (NYSE: CAG) today announced that its Board of Directors ...
Conagra Brands Reports Third Quarter Results
Today Conagra Brands, Inc. (NYSE: CAG) reported results for the third quarter ...
Conagra Brands Releases Fiscal Year 2023 Citizenship Report
Conagra Brands, Inc. (NYSE: CAG) today announced the publication of its ...