News Release
Conagra Brands Reports Second Quarter Results
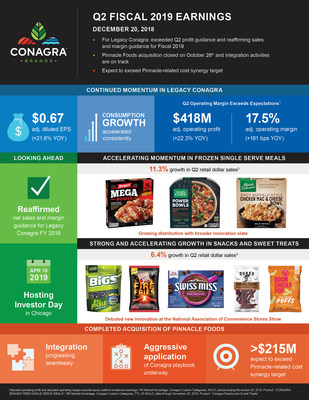
For Legacy Conagra: Exceeded Q2 Profit Guidance and Reaffirming Sales and Margin Guidance for Fiscal 2019
CHICAGO, Dec. 20, 2018 /PRNewswire/ -- Today Conagra Brands, Inc. (NYSE: CAG) reported results for the second quarter of fiscal year 2019, which ended on November 25, 2018. The Company completed the acquisition of Pinnacle Foods Inc. (Pinnacle) on October 26, 2018; these second quarter results include the impact of 31 days of Pinnacle ownership. All comparisons for Legacy Conagra results are against the prior-year fiscal period, unless otherwise noted. Certain terms used in this release, including "organic net sales," "retail sales," "Legacy Conagra," and certain "adjusted" results, are defined on page 6 of this release under the section entitled "Definitions."
Highlights
- As noted above, the Company completed the acquisition of Pinnacle on October 26, 2018.
- In the quarter, net sales grew 9.7%, driven primarily by the Pinnacle acquisition. Organic net sales excluding the sale of the Trenton, Missouri production facility (Trenton), decreased 1.6%. The Company estimates that 220 basis points of the decline in organic net sales growth is attributable to the impact of hurricanes in the prior-year period.
- The Refrigerated & Frozen segment continued its momentum in the second quarter, with net sales growth of 1.7% and organic net sales growth of 0.5%. The Legacy Conagra frozen business continued to deliver solid growth behind innovation-driven gains in distribution.
- Second quarter adjusted operating margin for Legacy Conagra was above the previously-provided second quarter guidance range and adjusted operating profit showed strong double-digit growth.
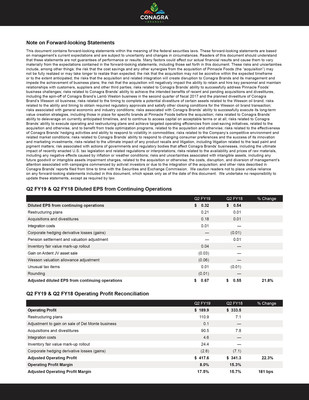
- Diluted earnings per share (EPS) from continuing operations decreased from $0.54 to $0.32 in the quarter, and adjusted diluted EPS from continuing operations grew 21.8% from $0.55 to $0.67. On a Legacy Conagra basis, adjusted diluted EPS for the quarter was above the Company's previously-provided second quarter guidance range.
- Informed by eight weeks of Pinnacle ownership, the Company expects to exceed the $215 million Pinnacle-related cost synergy target.
- The Company will host an Investor Day on April 10, 2019 in Chicago, Illinois where it will share more information on the Pinnacle synergy opportunities and the Company's long-term algorithm.
CEO Perspective
Sean Connolly, president and chief executive officer of Conagra Brands, commented on both the Legacy Conagra results and the newly acquired Pinnacle business. "For the Legacy Conagra Brands business, our second quarter results reflect continued momentum. Net sales were largely in line with our expectations. Our Refrigerated & Frozen and Grocery & Snacks segments continued to gain share with consistent, accelerating consumption trends behind strong innovation, particularly in our frozen and snacks & sweet treats businesses. Accordingly, we are reaffirming our fiscal 2019 net sales and margin guidance for Legacy Conagra Brands."
He continued, "In the short time since completing the Pinnacle acquisition, our team has been working hard on a seamless integration and an intense diagnostic to clarify both the challenges and opportunities within the Pinnacle portfolio. While we have identified challenges, they are clearly executional, not structural, in nature. We are aggressively applying Conagra's proven brand-building and innovation playbook to restore share growth. While this work will take time, we have done this before and remain confident in our ability to enhance Pinnacle's portfolio of leading brands and drive long-term shareholder value. Additionally, we expect to over-deliver on our cost synergy target. While we are starting from a lower base in fiscal 2019, we expect to deliver strong EPS growth off that base and hit the fiscal 2022 EPS target that drove our original EPS accretion guidance for this transaction, and we remain committed to our previously-communicated leverage target. We look forward to providing a more comprehensive update at our Investor Day."
Total Company Second Quarter Results
In the quarter, net sales increased 9.7%, reflecting:
- A 13.2 percentage point benefit from the acquisitions of Pinnacle, Angie's BOOMCHICKAPOP and Sandwich Bros. of Wisconsin
- A 1.5 percentage point decrease from the sales of the Trenton facility and the Canadian Del Monte business
- A 0.4 percentage point decrease from foreign exchange
On an organic net sales basis, excluding Trenton, net sales decreased 1.6% in the quarter. Largely in line with expectations, these results reflect:
- A 0.6 percentage point increase in price/mix in the Legacy Conagra business, with increased pricing in each Legacy Conagra reporting segment more than offsetting increases in retailer marketing
- An estimated 2.2 percentage point negative impact from the hurricanes in last year's comparable period; the volume decline of 2.2 percentage points in the Legacy Conagra business was primarily a result of the hurricane-related impact
In the quarter, gross profit increased 2.9% to $677 million. Adjusted gross profit increased 7.6% to $704 million or 29.5% of net sales. The addition of Pinnacle's gross profit, together with supply chain realized productivity and improved pricing in the Legacy Conagra business, more than offset higher transportation and input costs and the previously-mentioned increases in retailer marketing for the Legacy Conagra business.
In the quarter, selling, general, and administrative (SG&A) expenses increased 50.1% to $487 million, primarily due to the expenses related to the Pinnacle acquisition and associated restructuring plans. Adjusted SG&A expenses decreased 4.4% to $217 million, primarily as a result of lower incentive compensation expense in the Legacy Conagra business, including lower stock-based compensation expense due to a lower stock price compared to the prior-year period, partially offset by the addition of expenses related to the Pinnacle business.
Advertising and promotional (A&P) expense decreased 19.4% to $69 million in the quarter as the Company continued to shift investments in the Legacy Conagra business from A&P investments to retailer marketing.
Net interest expense increased $43 million to $81 million in the quarter. Adjusted interest expense increased $36 million to $74 million, primarily driven by higher levels of debt outstanding compared to the prior-year period. The increased level of debt outstanding was driven by the net debt incurred in connection with the Pinnacle acquisition.
The average diluted share count increased 11 million shares in the quarter to 422 million shares. The increase was primarily driven by the shares issued in connection with the Pinnacle acquisition, partially offset by share repurchases executed during fiscal 2018.
In the quarter, diluted EPS from continuing operations declined 40.7% to $0.32. Adjusted diluted EPS from continuing operations grew 21.8% to $0.67 as higher operating profit and a lower tax rate more than offset higher interest expense and an increased share count.
Grocery & Snacks Segment Second Quarter Results
Net sales for the Grocery & Snacks segment were relatively flat at $900 million in the quarter, and organic net sales declined 1.9%. The acquisition of Angie's BOOMCHICKAPOP added 180 basis points to the net sales growth rate, with the approximate 190 basis point impact of the hurricanes in the prior-year period more than offsetting this benefit. Volume declined 2.2%. The segment's net sales were negatively impacted by the previously-mentioned hurricane effects and declines in certain non-core grocery brands, as well as a reduction in certain shipments late in the second quarter, which shifted to the third quarter. However, the trends in the snacks & sweet treats business in the quarter were strong, with 6.4% retail sales growth. In addition, price/mix increased 0.3% as favorable pricing more than offset increased investments in retailer marketing.
Operating profit for the segment increased 4.6% to $209 million in the quarter and adjusted operating profit was approximately flat at $211 million. The segment delivered supply chain realized productivity and lower SG&A expenses to more than offset higher transportation and input costs.
Refrigerated & Frozen Segment Second Quarter Results
Net sales for the Refrigerated & Frozen segment increased 1.7% to $771 million in the quarter, and organic net sales grew 0.5%. The acquisition of Sandwich Bros. of Wisconsin added 120 basis points to the net sales growth rate. Volume grew 0.5% behind frozen innovation from brands across the portfolio, including Banquet, Healthy Choice, Marie Callender's, P.F. Chang's, and Frontera. The benefits of this innovation more than offset declines in net sales for specific refrigerated businesses. Frozen single serve meals continued to show positive trends, growing 11.3% in retail sales in the quarter. Price/mix was flat to the prior-year year period as the Company secured favorable pricing and mix but chose to support new innovation with increased retailer marketing.
Operating profit increased 7.6% in the quarter and adjusted operating profit increased 7.7% to $138 million. Increased net sales, coupled with solid supply chain realized productivity, and lower SG&A expenses more than offset higher transportation and input costs.
International Segment Second Quarter Results
Net sales for the International segment decreased 5.4% to $208 million in the quarter, and organic net sales increased 3.9%. The sale of the Canadian Del Monte business reduced the net sales growth rate by 600 basis points and the acquisition of Angie's BOOMCHICKAPOP increased the growth rate by 80 basis points. The impact of foreign exchange unfavorably impacted the net sales growth rate by 410 basis points. Volume grew 0.6%, led by strong growth in the snacking portfolio, specifically popcorn. Price/mix increased by 3.3% with the segment delivering favorable pricing and mix.
Operating profit increased 22.8% to $25 million in the quarter while adjusted operating profit increased 18.1%. The Company's ability to secure favorable pricing and mix, as well as supply chain realized productivity, offset higher input costs.
Foodservice Segment Second Quarter Results
Net sales for the Foodservice segment decreased 16.5% to $246 million in the quarter, and organic net sales excluding Trenton decreased 10.4%. The sale of the Trenton facility lowered the net sales growth rate by 6.1 percentage points and the Company estimates that the effect of the prior-year hurricanes reduced the organic net sales growth by approximately 10.2 percentage points. Volume declined 12.9% in the quarter, primarily driven by the previously-mentioned hurricane impact. Price/mix increased 2.5% as inflation-driven price increases more than offset unfavorable mix.
Operating profit decreased 31.2% in the quarter as the impacts of lower volume, unfavorable customer mix, and higher input costs more than offset supply chain realized productivity and lower SG&A expenses.
Pinnacle Segment Second Quarter Results
For the 31 days between the Pinnacle acquisition closing date and the quarter end, net sales for the Pinnacle segment totaled $259 million. Net sales were below expectations due to weak performance across a range of significant brands, as well as the impact of a product recall on Duncan Hines.
Operating profit for the Pinnacle segment totaled $29 million for the 31 days of the Company's ownership, and adjusted operating profit was $57 million. This performance was below expectations as the impacts of higher transportation costs and lower net sales were only partially offset by lower SG&A and A&P expenses in the business.
Other Second Quarter Items
Corporate expenses increased $181 million to $243 million in the quarter. Adjusted corporate expenses decreased 30.9% to $46 million, $47 million of which is related to Legacy Conagra; a $1 million gain is related to Pinnacle. The decrease is mainly due to lower incentive compensation expense, including lower stock-based compensation expense due to a lower stock price compared to the prior-year period.
Pension and postretirement non-service income decreased 44.4%, or $8 million, to $10 million in the quarter, reflecting the previously-disclosed asset mix shift in the Company's pension plans and the lapping of higher plan fees in the prior-year period.
Equity method investment earnings increased 83.4% to $38 million primarily due to a gain on the sale of an asset by the Ardent Mills joint venture. Adjusted equity method investment earnings increased 9.8% as the Ardent Mills joint venture continued to improve operational efficiencies and benefited from improved market conditions.
In the quarter, the effective tax rate was 14.3%, and the adjusted effective tax rate was 24.5%.
In the quarter, the Company paid a quarterly dividend of $0.2125 per share.
Portfolio Update
As previously noted, the Company completed its acquisition of Pinnacle on October 26, 2018.
As previously announced on December 18, 2018, the Company entered into a definitive agreement to divest the Wesson oil business. The Company expects to complete the transaction by the end of the first calendar quarter of 2019, subject to the satisfaction of customary closing conditions, including receipt of regulatory approval.
Fiscal 2019 Outlook
All guidance metrics shown below include the expected results for the Wesson oil business for the full time period indicated.
Reaffirming | Pinnacle* (Oct. 26, 2018 to | Impact of | Updated Total | |
Reported Net Sales | +0.5% to +1.5% | $1.70 to $1.75 billion | +$1.70 to $1.75 billion | +22% to +23% |
Organic Net Sales Growth (excl. Trenton impact) | +1.0% to +2.0% | n/a | n/a | +1.0% to +2.0% |
Adj. Gross Margin | 29.7% to 30.0% | 27.0% to 27.3% | ~ (40) bps | 29.3% to 29.6% |
Inflation Rate (% of COGS) | 3.0% to 3.2% | > 5% | n/a | n/a |
Adj. Operating Margin | 15.0% to 15.3% | 14.6% to 14.9% | (10) bps | 14.9% to 15.2% |
Adj. Effective Tax Rate | 23% to 24% | n/a | + ~1 ppt | 24% to 25% |
Adj. Net Interest Expense | n/a | n/a | n/a | $390 to $395 million |
Avg. Diluted Shares | n/a | n/a | n/a | ~ 446 million |
Adj. Diluted EPS from Cont. Ops. | n/a | n/a | n/a | $2.03 to $2.08 |
* The Pinnacle adjusted operating margin provided above is based on the expected profit in the Pinnacle segment, which includes $17 million of transaction-related amortization expense, and approximately $20 million of cost reduction synergies, as well as Pinnacle-related corporate expense. |
The inability to predict the amount and timing of the impacts of foreign exchange, acquisitions, divestitures, and other items impacting comparability makes a detailed reconciliation of these forward-looking non-GAAP financial measures impracticable. Please see the end of this release for more information.
Items Affecting Second Quarter Fiscal 2019 Comparability
Included in the $0.32 diluted EPS from continuing operations for the second quarter of fiscal 2019 (EPS amounts rounded and after tax)
- Approximately $0.21 per diluted share of net expense, or $110.9 million pre-tax ($86.6 million after tax), related to restructuring plans ($5.6 million in COGS and $105.3 million in SG&A)
- Approximately $0.01 per diluted share of net expense, or $4.6 million pre-tax ($3.4 million after tax), related to costs associated with the integration of Pinnacle (all SG&A)
- Approximately $0.18 per diluted share of net expense, or $96.8 million pre-tax ($76.7 million after tax), related to costs associated with acquisitions and divestitures ($6.3 million in interest expense and $90.5 million in SG&A)
- Approximately $0.04 per diluted share of net expense, or $24.4 million pre-tax ($18.2 million after tax), related to Pinnacle inventory fair value mark-up adjustment (all COGS)
- Approximately $0.03 per diluted share of net gain, or $15.1 million pre-tax ($11.6 million after tax), related to the gain on the sale of an asset within the Ardent Mills joint venture (all equity method investment earnings)
- Approximately $0.06 per diluted share of net tax benefit, or $24.3 million, related to the tax adjustment of valuation allowance associated with the planned divestiture of the Wesson oil brand (all Tax)
- Approximately $0.01 per diluted share of net tax expense, or $2.2 million, related to unusual tax items (all Tax)
- Approximately $0.01 per diluted share of beneficial impact due to rounding
Included in the $0.54 diluted EPS from continuing operations for the second quarter of fiscal 2018 (EPS amounts rounded and after tax)
- Approximately $0.01 per diluted share of net expense, or $7.1 million pre-tax ($4.6 million after tax), related to restructuring plans ($3.4 million in COGS and $3.7 million in SG&A)
- Approximately $0.01 per diluted share of net expense, or $7.8 million pre-tax ($5.0 million after tax), related to costs associated with acquisitions and divestitures (all SG&A)
- Approximately $0.01 per diluted share of net expense, or $4.1 million pre-tax ($2.5 million after tax), related to pension remeasurement (all Pension and Postretirement Non-Service Income)
- Approximately $0.01 per diluted share of net gain, or $7.1 million pre-tax ($4.4 million after tax), related to corporate hedging of derivatives (all COGS)
- Approximately $0.01 per diluted share of net tax benefit, or $5.3 million, related to unusual tax items (all Tax), related to an adjustment to the estimated tax expense on the earnings of foreign entities resulting from the repatriation of cash that occurred in the second quarter and the estimated taxes recorded in the first quarter on earnings of foreign entities that were not permanently reinvested
Definitions
Organic net sales growth excludes from reported net sales the impacts of foreign exchange, divested businesses and acquisitions, including the Pinnacle acquisition (until the anniversary date of the acquisitions). All references to changes in volume and price/mix throughout this release are on an organic net sales basis.
References to Legacy Conagra throughout this release refer to measures that exclude any income or expenses associated with the recently acquired Pinnacle business.
References to adjusted items throughout this release refer to measures computed in accordance with GAAP less the impact of items impacting comparability. Items impacting comparability are income or expenses (and related tax impacts) that management believes have had, or are likely to have, a significant impact on the earnings of the applicable business segment or on the total corporation for the period in which the item is recognized, and not indicative of the Company's core operating results. These items thus affect the comparability of underlying results from period to period.
References to retail sales are based on Conagra's IRI custom category definitions for the 13-week period ended November 25, 2018.
Discussion of Results
Conagra Brands will host a webcast and conference call at 9:30 a.m. Eastern time today to discuss the results. The live audio webcast and presentation slides will be available on www.conagrabrands.com/investor-relations under Events & Presentations. The conference call may be accessed by dialing 1-877-883-0383 for participants in the continental U.S. and 1-412-902-6506 for all other participants and using passcode 1874533. Please dial in 10 to 15 minutes prior to the call start time. Following the Company's remarks, the conference call will include a question-and-answer session with the investment community.
A replay of the webcast will be available on www.conagrabrands.com/investor-relations under Events & Presentations until December 20, 2019.
About Conagra Brands
Conagra Brands, Inc. (NYSE: CAG), headquartered in Chicago, is one of North America's leading branded food companies. Guided by an entrepreneurial spirit, Conagra Brands combines a rich heritage of making great food with a sharpened focus on innovation. The company's portfolio is evolving to satisfy people's changing food preferences. Conagra's iconic brands, such as Birds Eye®, Marie Callender's®, Banquet®, Healthy Choice®, Slim Jim®, Reddi-wip®, and Vlasic®, as well as emerging brands, including Angie's® BOOMCHICKAPOP®, Duke's®, Earth Balance®, Gardein®, and Frontera®, offer choices for every occasion. For more information, visit www.conagrabrands.com.
Note on Forward-looking Statements
This document contains forward-looking statements within the meaning of the federal securities laws. These forward-looking statements are based on management's current expectations and are subject to uncertainty and changes in circumstances. Readers of this document should understand that these statements are not guarantees of performance or results. Many factors could affect our actual financial results and cause them to vary materially from the expectations contained in the forward-looking statements, including those set forth in this document. These risks and uncertainties include, among other things: the risk that the cost savings and any other synergies from the acquisition of Pinnacle Foods (the "acquisition") may not be fully realized or may take longer to realize than expected; the risk that the acquisition may not be accretive within the expected timeframe or to the extent anticipated; the risks that the acquisition and related integration will create disruption to Conagra Brands and its management and impede the achievement of business plans; the risk that the acquisition will negatively impact the ability to retain and hire key personnel and maintain relationships with customers, suppliers and other third parties; risks related to Conagra Brands' ability to successfully address Pinnacle Foods' business challenges; risks related to Conagra Brands' ability to achieve the intended benefits of recent and pending acquisitions and divestitures, including the spin-off of Conagra Brand's Lamb Weston business in the second quarter of fiscal 2017 and the planned divestiture of Conagra Brand's Wesson oil business; risks related to the timing to complete a potential divestiture of certain assets related to the Wesson oil brand; risks related to the ability and timing to obtain required regulatory approvals and satisfy other closing conditions for the Wesson oil brand transaction; risks associated with general economic and industry conditions; risks associated with Conagra Brands' ability to successfully execute its long-term value creation strategies, including those in place for specific brands at Pinnacle Foods before the acquisition; risks related to Conagra Brands' ability to deleverage on currently anticipated timelines, and to continue to access capital on acceptable terms or at all; risks related to Conagra Brands' ability to execute operating and restructuring plans and achieve targeted operating efficiencies from cost-saving initiatives, related to the acquisition and otherwise, and to benefit from trade optimization programs, related to the acquisition and otherwise; risks related to the effectiveness of Conagra Brands' hedging activities and ability to respond to volatility in commodities; risks related to the Company's competitive environment and related market conditions; risks related to Conagra Brands' ability to respond to changing consumer preferences and the success of its innovation and marketing investments; risks related to the ultimate impact of any product recalls and litigation, including litigation related to the lead paint and pigment matters; risk associated with actions of governments and regulatory bodies that affect Conagra Brands' businesses, including the ultimate impact of recently enacted U.S. tax legislation and related regulations or interpretations; risks related to the availability and prices of raw materials, including any negative effects caused by inflation or weather conditions; risks and uncertainties associated with intangible assets, including any future goodwill or intangible assets impairment charges, related to the acquisition or otherwise; the costs, disruption, and diversion of management's attention associated with campaigns commenced by activist investors or due to the integration of the acquisition; and other risks described in Conagra Brands' reports filed from time to time with the Securities and Exchange Commission. We caution readers not to place undue reliance on any forward-looking statements included in this document, which speak only as of the date of this document. We undertake no responsibility to update these statements, except as required by law.
Note on Non-GAAP Financial Measures
This document includes certain non-GAAP financial measures, including adjusted diluted EPS from continuing operations, organic net sales, adjusted gross profit, adjusted operating profit, adjusted gross margin, adjusted SG&A expenses, adjusted corporate expenses, adjusted equity method investment earnings, adjusted operating margin, adjusted effective tax rate and adjusted net interest expense. Management considers GAAP financial measures as well as such non-GAAP financial information in its evaluation of the Company's financial statements and believes these non-GAAP measures provide useful supplemental information to assess the Company's operating performance and financial position. These measures should be viewed in addition to, and not in lieu of, the Company's diluted earnings per share, operating performance and financial measures as calculated in accordance with GAAP.
Certain of these non-GAAP measures, such as organic net sales, adjusted gross margin, adjusted operating margin, adjusted effective tax rate, adjusted net interest expense, and adjusted diluted EPS from continuing operations, are forward-looking. Historically, the Company has excluded the impact of certain items impacting comparability, such as, but not limited to, restructuring expenses, the impact of the extinguishment of debt, the impact of foreign exchange, the impact of acquisitions and divestitures, hedging gains and losses, impairment charges, the impact of legacy legal contingencies, and the impact of unusual tax items, from the non-GAAP financial measures it presents. Reconciliations of these forward-looking non-GAAP financial measures to the most directly comparable GAAP financial measures are not provided because the Company is unable to provide such reconciliations without unreasonable effort, due to the uncertainty and inherent difficulty of predicting the occurrence and the financial impact of such items impacting comparability and the periods in which such items may be recognized. For the same reasons, the Company is unable to address the probable significance of the unavailable information, which could be material to future results.
Hedge gains and losses are generally aggregated, and net amounts are reclassified from unallocated corporate expense to the operating segments when the underlying commodity or foreign currency being hedged is expensed in segment cost of goods sold. The Company identifies these amounts as items that impact comparability within the discussion of unallocated Corporate results.
For more information, please contact:
MEDIA: Mike Cummins
312-549-5257
Michael.Cummins@conagra.com
INVESTORS: Brian Kearney
312-549-5002
IR@conagra.com
Conagra Brands, Inc. | ||||||||||
Consolidated Statements of Earnings | ||||||||||
(in millions) | ||||||||||
(unaudited) | ||||||||||
SECOND QUARTER | ||||||||||
Thirteen weeks | Thirteen weeks | |||||||||
November 25, 2018 | November 26, 2017 | Percent Change | ||||||||
Net sales | $ | 2,383.7 | $ | 2,173.4 | 9.7 | % | ||||
Costs and expenses: | ||||||||||
Cost of goods sold | 1,706.5 | 1,515.1 | 12.6 | % | ||||||
Selling, general and administrative expenses | 487.3 | 324.8 | 50.1 | % | ||||||
Pension and postretirement non-service income | (9.7) | (17.5) | (44.4) | % | ||||||
Interest expense, net | 80.6 | 38.0 | 112.5 | % | ||||||
Income from continuing operations before income taxes and equity method investment earnings | 119.0 | 313.0 | (62.0) | % | ||||||
Income tax expense | 22.4 | 109.5 | (79.6) | % | ||||||
Equity method investment earnings | 37.7 | 20.6 | 83.4 | % | ||||||
Income from continuing operations | 134.3 | 224.1 | (40.1) | % | ||||||
Income (loss) from discontinued operations, net of tax | (1.9) | 0.4 | N/A | |||||||
Net income | $ | 132.4 | $ | 224.5 | (41.0) | % | ||||
Less: Net income attributable to noncontrolling interests | 0.8 | 1.0 | (17.9) | % | ||||||
Net income attributable to Conagra Brands, Inc. | $ | 131.6 | $ | 223.5 | (41.1) | % | ||||
Earnings per share - basic | ||||||||||
Income from continuing operations | $ | 0.32 | $ | 0.55 | (41.8) | % | ||||
Loss from discontinued operations | (0.01) | — | — | % | ||||||
Net income attributable to Conagra Brands, Inc. | $ | 0.31 | $ | 0.55 | (43.6) | % | ||||
Weighted average shares outstanding | 419.9 | 406.5 | 3.3 | % | ||||||
Earnings per share - diluted | ||||||||||
Income from continuing operations | $ | 0.32 | $ | 0.54 | (40.7) | % | ||||
Loss from discontinued operations | (0.01) | — | — | % | ||||||
Net income attributable to Conagra Brands, Inc. | $ | 0.31 | $ | 0.54 | (42.6) | % | ||||
Weighted average share and share equivalents outstanding | 421.8 | 410.4 | 2.8 | % | ||||||
Conagra Brands, Inc. | ||||||||||
Consolidated Statements of Earnings | ||||||||||
(in millions) | ||||||||||
(unaudited) | ||||||||||
SECOND QUARTER | ||||||||||
Twenty-six weeks | Twenty-six weeks | |||||||||
November 25, 2018 | November 26, 2017 | Percent Change | ||||||||
Net sales | $ | 4,218.1 | $ | 3,977.6 | 6.0 | % | ||||
Costs and expenses: | ||||||||||
Cost of goods sold | 3,025.4 | 2,800.3 | 8.0 | % | ||||||
Selling, general and administrative expenses | 744.6 | 584.4 | 27.4 | % | ||||||
Pension and postretirement non-service income | (19.9) | (38.1) | (47.7) | % | ||||||
Interest expense, net | 129.6 | 74.4 | 74.3 | % | ||||||
Income from continuing operations before income taxes and equity method investment earnings | 338.4 | 556.6 | (39.2) | % | ||||||
Income tax expense | 79.8 | 229.5 | (65.2) | % | ||||||
Equity method investment earnings | 53.9 | 50.6 | 6.7 | % | ||||||
Income from continuing operations | 312.5 | 377.7 | (17.3) | % | ||||||
Income (loss) from discontinued operations, net of tax | (1.9) | 0.1 | N/A | |||||||
Net income | $ | 310.6 | $ | 377.8 | (17.8) | % | ||||
Less: Net income attributable to noncontrolling interests | 0.8 | 1.8 | (54.7) | % | ||||||
Net income attributable to Conagra Brands, Inc. | $ | 309.8 | $ | 376.0 | (17.6) | % | ||||
Earnings per share - basic | ||||||||||
Income from continuing operations | $ | 0.76 | $ | 0.91 | (16.5) | % | ||||
Income from discontinued operations | — | — | — | % | ||||||
Net income attributable to Conagra Brands, Inc. | $ | 0.76 | $ | 0.91 | (16.5) | % | ||||
Weighted average shares outstanding | 407.7 | 411.1 | (0.8) | % | ||||||
Earnings per share - diluted | ||||||||||
Income from continuing operations | $ | 0.76 | $ | 0.91 | (16.5) | % | ||||
Income from discontinued operations | — | — | — | % | ||||||
Net income attributable to Conagra Brands, Inc. | $ | 0.76 | $ | 0.91 | (16.5) | % | ||||
Weighted average share and share equivalents outstanding | 409.9 | 415.1 | (1.3) | % | ||||||
Conagra Brands, Inc. | ||||||||
Consolidated Balance Sheets | ||||||||
(in millions) | ||||||||
(unaudited) | ||||||||
November 25, 2018 | May 27, 2018 | |||||||
ASSETS | ||||||||
Current assets | ||||||||
Cash and cash equivalents | $ | 442.3 | $ | 128.0 | ||||
Receivables, less allowance for doubtful accounts of $2.8 and $2.0 | 958.1 | 582.6 | ||||||
Inventories | 1,729.7 | 997.1 | ||||||
Prepaid expenses and other current assets | 108.7 | 186.8 | ||||||
Current assets held for sale | 36.6 | 44.4 | ||||||
Total current assets | 3,275.4 | 1,938.9 | ||||||
Property, plant and equipment, net | 2,360.8 | 1,620.1 | ||||||
Goodwill | 11,167.2 | 4,502.5 | ||||||
Brands, trademarks and other intangibles, net | 5,132.2 | 1,284.5 | ||||||
Other assets | 960.4 | 906.3 | ||||||
Noncurrent assets held for sale | 110.8 | 137.2 | ||||||
$ | 23,006.8 | $ | 10,389.5 | |||||
LIABILITIES AND STOCKHOLDERS' EQUITY | ||||||||
Current liabilities | ||||||||
Notes payable | $ | 0.9 | $ | 277.3 | ||||
Current installments of long-term debt | 17.2 | 307.0 | ||||||
Accounts payable | 1,246.1 | 915.1 | ||||||
Accrued payroll | 177.0 | 163.9 | ||||||
Other accrued liabilities | 793.3 | 672.9 | ||||||
Total current liabilities | 2,234.5 | 2,336.2 | ||||||
Senior long-term debt, excluding current installments | 11,349.5 | 3,035.6 | ||||||
Subordinated debt | 195.9 | 195.9 | ||||||
Other noncurrent liabilities | 1,923.6 | 1,065.2 | ||||||
Total stockholders' equity | 7,303.3 | 3,756.6 | ||||||
$ | 23,006.8 | $ | 10,389.5 | |||||
Conagra Brands, Inc. and Subsidiaries | |||||||
Condensed Consolidated Statements of Cash Flows | |||||||
(in millions) | |||||||
(unaudited) | |||||||
Twenty-six weeks ended | |||||||
November 25, | November 26, | ||||||
Cash flows from operating activities: | |||||||
Net income | $ | 310.6 | $ | 377.8 | |||
Income (loss) from discontinued operations | (1.9) | 0.1 | |||||
Income from continuing operations | 312.5 | 377.7 | |||||
Adjustments to reconcile income from continuing operations to net cash flows from operating activities: | |||||||
Depreciation and amortization | 140.3 | 129.0 | |||||
Asset impairment charges | 2.3 | 8.8 | |||||
Gain on divestiture | (13.2) | — | |||||
Earnings of affiliates in excess of distributions | (26.1) | (50.6) | |||||
Stock-settled share-based payments expense | 18.7 | 17.7 | |||||
Contributions to pension plans | (7.9) | (6.1) | |||||
Pension benefit | (13.8) | (21.5) | |||||
Proceeds from settlement of interest rate swaps | 47.5 | — | |||||
Other items | 22.5 | 3.8 | |||||
Change in operating assets and liabilities excluding effects of business acquisitions and dispositions: | |||||||
Receivables | (186.5) | (109.8) | |||||
Inventories | (75.2) | (130.5) | |||||
Deferred income taxes and income taxes payable, net | 17.9 | 95.3 | |||||
Prepaid expenses and other current assets | (21.2) | 0.1 | |||||
Accounts payable | 39.0 | 132.3 | |||||
Accrued payroll | (1.2) | (39.7) | |||||
Other accrued liabilities | (4.9) | (1.8) | |||||
Net cash flows from operating activities — continuing operations | 250.7 | 404.7 | |||||
Net cash flows from operating activities — discontinued operations | 11.2 | 16.0 | |||||
Net cash flows from operating activities | 261.9 | 420.7 | |||||
Cash flows from investing activities: | |||||||
Additions to property, plant and equipment | (133.3) | (123.4) | |||||
Sale of property, plant and equipment | 17.7 | 6.9 | |||||
Purchase of businesses, net of cash acquired | (5,119.2) | (249.6) | |||||
Proceeds from divestiture | 32.2 | — | |||||
Other items | 0.1 | — | |||||
Net cash flows from investing activities | (5,202.5) | (366.1) | |||||
Cash flows from financing activities: | |||||||
Net short-term borrowings | (277.4) | 38.9 | |||||
Issuance of long-term debt | 8,310.5 | 500.0 | |||||
Repayment of long-term debt | (3,061.3) | (4.8) | |||||
Debt issuance costs and bridge financing fees | (87.0) | (2.6) | |||||
Payment of intangible asset financing arrangement | (14.0) | (14.4) | |||||
Issuance of Conagra Brands, Inc. common shares, net | 555.9 | — | |||||
Repurchase of Conagra Brands, Inc. common shares | — | (580.0) | |||||
Cash dividends paid | (166.3) | (171.6) | |||||
Exercise of stock options and issuance of other stock awards, including tax withholdings | (3.7) | 4.0 | |||||
Net cash flows from financing activities | 5,256.7 | (230.5) | |||||
Effect of exchange rate changes on cash and cash equivalents and restricted cash | (1.8) | 8.5 | |||||
Net change in cash and cash equivalents and restricted cash | 314.3 | (167.4) | |||||
Cash and cash equivalents and restricted cash at beginning of period | 129.0 | 252.4 | |||||
Cash and cash equivalents and restricted cash at end of period | $ | 443.3 | $ | 85.0 | |||
Conagra Brands, Inc. | ||||||||||||||||||
Reconciliation of Non-GAAP Financial Measures to Reported Financial Measures | ||||||||||||||||||
(in millions) | ||||||||||||||||||
Q2 FY19 | Grocery & | Refrigerated & | International | Foodservice | Pinnacle | Total Conagra | ||||||||||||
Net Sales | $ | 899.7 | $ | 770.9 | $ | 208.3 | $ | 246.0 | $ | 258.8 | $ | 2,383.7 | ||||||
Impact of foreign exchange | — | — | 9.1 | — | — | 9.1 | ||||||||||||
Net sales from acquired businesses | (16.4) | (9.0) | (1.8) | — | (258.8) | (286.0) | ||||||||||||
Organic Net Sales ex Trenton | $ | 883.3 | $ | 761.9 | $ | 215.6 | $ | 246.0 | $ | — | $ | 2,106.8 | ||||||
Year-over-year change - Net Sales | (0.1) | % | 1.7 | % | (5.4) | % | (16.5) | % | 100.0 | % | 9.7 | % | ||||||
Impact of foreign exchange (pp) | — | — | 4.1 | — | — | 0.4 | ||||||||||||
Net sales from acquired businesses (pp) | (1.8) | (1.2) | (0.8) | — | (100.0) | (13.2) | ||||||||||||
Net sales from divested businesses (pp) | — | — | 6.0 | — | — | 0.6 | ||||||||||||
Net sales from sold Trenton plant (pp) | — | — | — | 6.1 | — | 0.9 | ||||||||||||
Organic Net Sales ex Trenton Growth | (1.9) | % | 0.5 | % | 3.9 | % | (10.4) | % | — | % | (1.6) | % | ||||||
Volume (Organic) | (2.2) | % | 0.5 | % | 0.6 | % | (12.9) | % | — | % | (2.2) | % | ||||||
Price/Mix | 0.3 | % | — | % | 3.3 | % | 2.5 | % | — | % | 0.6 | % | ||||||
Q2 FY18 | Grocery & | Refrigerated & | International | Foodservice | Pinnacle | Total Conagra | ||||||||||||
Net Sales | $ | 900.4 | $ | 758.1 | $ | 220.3 | $ | 294.6 | $ | — | $ | 2,173.4 | ||||||
Net sales from divested businesses | — | — | (12.6) | — | — | (12.6) | ||||||||||||
Net sales from sold Trenton plant | — | — | — | (20.2) | — | (20.2) | ||||||||||||
Organic Net Sales ex Trenton | $ | 900.4 | $ | 758.1 | $ | 207.7 | $ | 274.4 | $ | — | $ | 2,140.6 | ||||||
Q2 FY19 YTD | Grocery & | Refrigerated & | International | Foodservice | Pinnacle | Total Conagra | ||||||||||||
Net Sales | $ | 1,670.8 | $ | 1,406.1 | $ | 402.1 | $ | 480.3 | $ | 258.8 | $ | 4,218.1 | ||||||
Impact of foreign exchange | — | — | 15.0 | — | — | 15.0 | ||||||||||||
Net sales from acquired businesses | (41.3) | (19.6) | (3.7) | — | (258.8) | (323.4) | ||||||||||||
Net sales from divested businesses | — | — | (4.1) | — | — | (4.1) | ||||||||||||
Net sales from sold Trenton plant | — | — | — | (2.0) | — | (2.0) | ||||||||||||
Organic Net Sales ex Trenton | $ | 1,629.5 | $ | 1,386.5 | $ | 409.3 | $ | 478.3 | $ | — | $ | 3,903.6 | ||||||
Year-over-year change - Net Sales | 1.5 | % | 2.4 | % | (2.2) | % | (12.1) | % | 100.0 | % | 6.0 | % | ||||||
Impact of foreign exchange (pp) | — | — | 3.7 | — | — | 0.4 | ||||||||||||
Net sales from acquired businesses (pp) | (2.5) | (1.5) | (0.8) | — | (100.0) | (8.1) | ||||||||||||
Net sales from divested businesses (pp) | — | — | 4.3 | — | — | 0.4 | ||||||||||||
Net sales from sold Trenton plant (pp) | — | — | — | 6.5 | — | 1.0 | ||||||||||||
Organic Net Sales ex Trenton Growth | (1.0) | % | 0.9 | % | 5.0 | % | (5.6) | % | — | % | (0.3) | % | ||||||
Volume (Organic) | (1.2) | % | 0.5 | % | 2.4 | % | (9.2) | % | — | % | (1.2) | % | ||||||
Price/Mix | 0.2 | % | 0.4 | % | 2.6 | % | 3.6 | % | — | % | 0.9 | % | ||||||
Q2 FY18 YTD | Grocery & | Refrigerated & | International | Foodservice | Pinnacle | Total Conagra | ||||||||||||
Net Sales | $ | 1,646.2 | $ | 1,373.8 | $ | 411.2 | $ | 546.4 | $ | — | $ | 3,977.6 | ||||||
Net sales from divested businesses | — | — | (21.3) | — | — | (21.3) | ||||||||||||
Net sales from sold Trenton plant | — | — | — | (39.8) | — | (39.8) | ||||||||||||
Organic Net Sales ex Trenton | $ | 1,646.2 | $ | 1,373.8 | $ | 389.9 | $ | 506.6 | $ | — | $ | 3,916.5 | ||||||
Conagra Brands, Inc. | |||||||||||||||||||||
Reconciliation of Non-GAAP Financial Measures to Reported Financial Measures | |||||||||||||||||||||
(in millions) | |||||||||||||||||||||
Q2 FY19 | Grocery & | Refrigerated | International | Foodservice | Pinnacle | Corporate | Total | ||||||||||||||
Operating Profit | $ | 209.0 | $ | 138.1 | $ | 24.8 | $ | 32.7 | $ | 28.7 | $ | (243.4) | $ | 189.9 | |||||||
Restructuring plans | 2.1 | 0.1 | — | — | 3.8 | 104.9 | 110.9 | ||||||||||||||
Adjustment to gain on sale of Del Monte business | — | — | 0.1 | — | — | — | 0.1 | ||||||||||||||
Acquisitions and divestitures | 0.3 | — | — | — | — | 90.2 | 90.5 | ||||||||||||||
Integration costs | — | — | — | — | — | 4.6 | 4.6 | ||||||||||||||
Inventory fair value mark-up rollout | — | — | — | — | 24.4 | — | 24.4 | ||||||||||||||
Corporate hedging derivative losses (gains) | — | — | — | — | — | (2.8) | (2.8) | ||||||||||||||
Adjusted Operating Profit | $ | 211.4 | $ | 138.2 | $ | 24.9 | $ | 32.7 | $ | 56.9 | $ | (46.5) | $ | 417.6 | |||||||
Operating Profit Margin | 23.2 | % | 17.9 | % | 11.9 | % | 13.3 | % | 11.1 | % | 8.0 | % | |||||||||
Adjusted Operating Profit Margin | 23.5 | % | 17.9 | % | 11.9 | % | 13.3 | % | 22.0 | % | 17.5 | % | |||||||||
Year-over-year % change - Operating Profit | 4.6 | % | 7.6 | % | 22.8 | % | (31.2) | % | 100.0 | % | 290.4 | % | (43.1) | % | |||||||
Year-over year % change - Adjusted Operating Profit | (0.2) | % | 7.7 | % | 18.1 | % | (31.2) | % | 100.0 | % | (30.9) | % | 22.3 | % | |||||||
Year-over-year bps change - Adjusted Operating Profit | (2) bps | 100 bps | 238 bps | (282) bps | N/A | 181 bps | |||||||||||||||
Q2 FY18 | Grocery & | Refrigerated | International | Foodservice | Pinnacle | Corporate | Total | ||||||||||||||
Operating Profit | $ | 199.8 | $ | 128.5 | $ | 20.2 | $ | 47.4 | $ | — | $ | (62.4) | $ | 333.5 | |||||||
Restructuring plans | 4.0 | — | 0.9 | — | — | 2.2 | 7.1 | ||||||||||||||
Acquisitions and divestitures | 7.8 | — | — | — | — | — | 7.8 | ||||||||||||||
Corporate hedging derivative losses (gains) | — | — | — | — | — | (7.1) | (7.1) | ||||||||||||||
Adjusted Operating Profit | $ | 211.6 | $ | 128.5 | $ | 21.1 | $ | 47.4 | $ | — | $ | (67.3) | $ | 341.3 | |||||||
Operating Profit Margin | 22.2 | % | 16.9 | % | 9.2 | % | 16.1 | % | — | % | 15.3 | % | |||||||||
Adjusted Operating Profit Margin | 23.5 | % | 16.9 | % | 9.6 | % | 16.1 | % | — | % | 15.7 | % | |||||||||
Conagra Brands, Inc. | |||||||||||||||||||||
Reconciliation of Non-GAAP Financial Measures to Reported Financial Measures | |||||||||||||||||||||
(in millions) | |||||||||||||||||||||
Q2 FY19 YTD | Grocery & | Refrigerated | International | Foodservice | Pinnacle | Corporate | Total | ||||||||||||||
Operating Profit | $ | 387.7 | $ | 233.6 | $ | 62.1 | $ | 60.2 | $ | 28.7 | $ | (324.2) | $ | 448.1 | |||||||
Restructuring plans | 2.2 | 0.1 | 0.2 | — | 3.8 | 105.8 | 112.1 | ||||||||||||||
Gain on sale of Del Monte business | — | — | (13.2) | — | — | — | (13.2) | ||||||||||||||
Acquisitions and divestitures | 0.9 | — | 2.9 | — | — | 97.7 | 101.5 | ||||||||||||||
Integration costs | — | — | — | — | — | 8.9 | 8.9 | ||||||||||||||
Inventory fair value mark-up rollout | — | — | — | — | 24.4 | — | 24.4 | ||||||||||||||
Corporate hedging derivative losses (gains) | — | — | — | — | — | 3.6 | 3.6 | ||||||||||||||
Adjusted Operating Profit | $ | 390.8 | $ | 233.7 | $ | 52.0 | $ | 60.2 | $ | 56.9 | $ | (108.2) | $ | 685.4 | |||||||
Operating Profit Margin | 23.2 | % | 16.6 | % | 15.4 | % | 12.5 | % | 11.1 | % | 10.6 | % | |||||||||
Adjusted Operating Profit Margin | 23.4 | % | 16.6 | % | 12.9 | % | 12.5 | % | 22.0 | % | 16.2 | % | |||||||||
Year-over-year % change - Operating Profit | 3.1 | % | 1.4 | % | 58.8 | % | (14.8) | % | 100.0 | % | 163.3 | % | (24.4) | % | |||||||
Year-over year % change - Adjusted Operating Profit | (1.0) | % | 1.5 | % | 30.1 | % | (14.8) | % | 100.0 | % | (7.3) | % | 10.7 | % | |||||||
Year-over-year bps change - Adjusted Operating Profit | (60) bps | (14) bps | 321 bps | (40) bps | N/A | 68 bps | |||||||||||||||
Q2 FY18 YTD | Grocery & | Refrigerated | International | Foodservice | Pinnacle | Corporate | Total | ||||||||||||||
Operating Profit | $ | 376.0 | $ | 230.4 | $ | 39.1 | $ | 70.6 | $ | — | $ | (123.2) | $ | 592.9 | |||||||
Restructuring plans | 10.2 | — | 0.9 | — | — | 7.4 | 18.5 | ||||||||||||||
Acquisitions and divestitures | 8.6 | — | — | — | — | — | 8.6 | ||||||||||||||
Corporate hedging derivative losses (gains) | — | — | — | — | — | (1.1) | (1.1) | ||||||||||||||
Adjusted Operating Profit | $ | 394.8 | $ | 230.4 | $ | 40.0 | $ | 70.6 | $ | — | $ | (116.9) | $ | 618.9 | |||||||
Operating Profit Margin | 22.8 | % | 16.8 | % | 9.5 | % | 12.9 | % | — | % | 14.9 | % | |||||||||
Adjusted Operating Profit Margin | 24.0 | % | 16.8 | % | 9.7 | % | 12.9 | % | — | % | 15.6 | % | |||||||||
Conagra Brands, Inc. | ||||||||||||||||||||||||
Reconciliation of Non-GAAP Financial Measures to Reported Financial Measures | ||||||||||||||||||||||||
(in millions) | ||||||||||||||||||||||||
Q2 FY19 | Gross profit | Selling, | Operating profit 1 | Income from | Income | Income | Net income | Diluted EPS from | ||||||||||||||||
Reported | $ | 677.2 | $ | 487.3 | $ | 189.9 | $ | 119.0 | $ | 22.4 | 14.3 | % | $ | 131.6 | $ | 0.32 | ||||||||
% of Net Sales | 28.4 | % | 20.4 | % | 8.0 | % | ||||||||||||||||||
Restructuring plans | 5.6 | 105.3 | 110.9 | 110.9 | 24.3 | 86.6 | 0.21 | |||||||||||||||||
Acquisitions and divestitures | — | 90.5 | 90.5 | 96.8 | 20.1 | 76.7 | 0.18 | |||||||||||||||||
Integration costs | — | 4.6 | 4.6 | 4.6 | 1.2 | 3.4 | 0.01 | |||||||||||||||||
Corporate hedging derivative losses (gains) | (2.8) | — | (2.8) | (2.8) | (0.7) | (2.1) | — | |||||||||||||||||
Advertising and promotion expenses 2 | — | 69.4 | — | — | — | — | — | |||||||||||||||||
Inventory fair value mark-up rollout | 24.4 | — | 24.4 | 24.4 | 6.2 | 18.2 | 0.04 | |||||||||||||||||
Adjustment to gain on sale of Del Monte business | — | 0.1 | 0.1 | 0.1 | — | 0.1 | — | |||||||||||||||||
Gain on Ardent JV asset sale | — | — | — | — | (3.5) | (11.6) | (0.03) | |||||||||||||||||
Wesson valuation allowance adjustment | — | — | — | — | 24.3 | (24.3) | (0.06) | |||||||||||||||||
Unusual tax items | — | — | — | — | (2.2) | 2.2 | 0.01 | |||||||||||||||||
Loss from discontinued operations, net of noncontrolling interests | — | — | — | — | — | 1.9 | — | |||||||||||||||||
Rounding | — | — | — | — | — | — | (0.01) | |||||||||||||||||
Adjusted | $ | 704.4 | $ | 217.4 | $ | 417.6 | $ | 353.0 | $ | 92.1 | 24.5 | % | $ | 282.7 | $ | 0.67 | ||||||||
% of Net Sales | 29.5 | % | 9.1 | % | 17.5 | % | ||||||||||||||||||
Year-over-year % of net sales change - reported | (188) bps | 550 bps | (738) bps | |||||||||||||||||||||
Year-over-year % of net sales change - adjusted | (58) bps | (134) bps | 181 bps | |||||||||||||||||||||
Year-over-year change - reported | 2.9 | % | 50.1 | % | (43.1) | % | (62.0) | % | (79.6) | % | (41.1) | % | (40.7) | % | ||||||||||
Year-over-year change - adjusted | 7.6 | % | (4.4) | % | 22.3 | % | 8.6 | % | (22.6) | % | 25.3 | % | 21.8 | % | ||||||||||
Q2 FY18 | Gross profit | Selling, | Operating profit 1 | Income from | Income | Income | Net income | Diluted EPS from | ||||||||||||||||
Reported | $ | 658.3 | $ | 324.8 | $ | 333.5 | $ | 313.0 | $ | 109.5 | 32.8 | % | $ | 223.5 | $ | 0.54 | ||||||||
% of Net Sales | 30.3 | % | 14.9 | % | 15.3 | % | ||||||||||||||||||
Restructuring plans | 3.4 | 3.7 | 7.1 | 7.1 | 2.5 | 4.6 | 0.01 | |||||||||||||||||
Acquisitions and divestitures | — | 7.8 | 7.8 | 7.8 | 2.8 | 5.0 | 0.01 | |||||||||||||||||
Corporate hedging derivative losses (gains) | (7.1) | — | (7.1) | (7.1) | (2.7) | (4.4) | (0.01) | |||||||||||||||||
Pension settlement and valuation adjustment | — | — | — | 4.1 | 1.6 | 2.5 | 0.01 | |||||||||||||||||
Advertising and promotion expenses 2 | — | 86.0 | — | — | — | — | — | |||||||||||||||||
Unusual tax items | — | — | — | — | 5.3 | (5.3) | (0.01) | |||||||||||||||||
Income from discontinued operations, net of noncontrolling interests | — | — | — | — | — | (0.4) | — | |||||||||||||||||
Adjusted | $ | 654.6 | $ | 227.3 | $ | 341.3 | $ | 324.9 | $ | 119.0 | 34.4 | % | $ | 225.5 | $ | 0.55 | ||||||||
% of Net Sales | 30.1 | % | 10.5 | % | 15.7 | % | ||||||||||||||||||
1 Operating profit is derived from taking Income from continuing operations before income taxes and equity method investment earnings, adding back Interest expense, net and removing Pension and postretirement non-service income. |
2 Advertising and promotion expense (A&P) has been removed from adjusted selling, general and administrative expense because this metric is used in reporting to management, and management believes this adjusted measure provides useful supplemental information to assess the Company's operating performance. Please note that A&P is not removed from adjusted profit measures. |
Conagra Brands, Inc. | ||||||||||||||||||||||||
Reconciliation of Non-GAAP Financial Measures to Reported Financial Measures | ||||||||||||||||||||||||
(in millions) | ||||||||||||||||||||||||
Q2 FY19 YTD | Gross profit | Selling, | Operating profit 1 | Income from | Income | Income | Net income | Diluted EPS from | ||||||||||||||||
Reported | $ | 1,192.7 | $ | 744.6 | $ | 448.1 | $ | 338.4 | $ | 79.8 | 20.3 | % | $ | 309.8 | $ | 0.76 | ||||||||
% of Net Sales | 28.3 | % | 17.7 | % | 10.6 | % | ||||||||||||||||||
Restructuring plans | 7.9 | 104.2 | 112.1 | 111.5 | 24.5 | 87.0 | 0.21 | |||||||||||||||||
Acquisitions and divestitures | — | 101.5 | 101.5 | 113.4 | 22.4 | 91.0 | 0.22 | |||||||||||||||||
Integration costs | — | 8.9 | 8.9 | 8.9 | 2.3 | 6.6 | 0.02 | |||||||||||||||||
Corporate hedging derivative losses (gains) | 3.6 | — | 3.6 | 3.6 | 0.9 | 2.7 | 0.01 | |||||||||||||||||
Advertising and promotion expenses 2 | — | 112.1 | — | — | — | — | — | |||||||||||||||||
Inventory fair value mark-up rollout | 24.4 | — | 24.4 | 24.4 | 6.2 | 18.2 | 0.04 | |||||||||||||||||
Gain on sale of Del Monte business | — | (13.2) | (13.2) | (13.2) | (3.6) | (9.6) | (0.02) | |||||||||||||||||
Gain on Ardent JV asset sale | — | — | — | — | (3.5) | (11.6) | (0.03) | |||||||||||||||||
Wesson valuation allowance adjustment | — | — | — | — | 24.3 | (24.3) | (0.06) | |||||||||||||||||
Unusual tax items | — | — | — | — | 2.6 | (2.6) | (0.01) | |||||||||||||||||
Loss from discontinued operations, net of noncontrolling interests | — | — | — | — | — | 1.9 | — | |||||||||||||||||
Adjusted | $ | 1,228.6 | $ | 431.1 | $ | 685.4 | $ | 587.0 | $ | 155.9 | 24.9 | % | $ | 469.1 | $ | 1.14 | ||||||||
% of Net Sales | 29.1 | % | 10.2 | % | 16.2 | % | ||||||||||||||||||
Year-over-year % of net sales change - reported | (132) bps | 296 bps | (428) bps | |||||||||||||||||||||
Year-over-year % of net sales change - adjusted | (59) bps | (39) bps | 68 bps | |||||||||||||||||||||
Year-over-year change - reported | 1.3 | % | 27.4 | % | (24.4) | % | (39.2) | % | (65.2) | % | (17.6) | % | (16.5) | % | ||||||||||
Year-over-year change - adjusted | 3.9 | % | 2.1 | % | 10.7 | % | — | % | (28.4) | % | 12.3 | % | 12.9 | % | ||||||||||
Q2 FY18 YTD | Gross profit | Selling, | Operating profit 1 | Income from | Income | Income | Net income | Diluted EPS from | ||||||||||||||||
Reported | $ | 1,177.3 | $ | 584.4 | $ | 592.9 | $ | 556.6 | $ | 229.5 | 37.8 | % | $ | 376.0 | $ | 0.91 | ||||||||
% of Net Sales | 29.6 | % | 14.7 | % | 14.9 | % | ||||||||||||||||||
Restructuring plans | 5.7 | 12.8 | 18.5 | 18.5 | 6.5 | 12.0 | 0.03 | |||||||||||||||||
Acquisitions and divestitures | — | 8.6 | 8.6 | 8.6 | 3.1 | 5.5 | 0.01 | |||||||||||||||||
Corporate hedging derivative losses (gains) | (1.1) | — | (1.1) | (1.1) | (0.4) | (0.7) | — | |||||||||||||||||
Pension settlement and valuation adjustment | — | — | — | 4.1 | 1.6 | 2.5 | 0.01 | |||||||||||||||||
Advertising and promotion expenses 2 | — | 140.9 | — | — | — | — | — | |||||||||||||||||
Unusual tax items | — | — | — | — | (22.5) | 22.5 | 0.05 | |||||||||||||||||
Income from discontinued operations, net of noncontrolling interests | — | — | — | — | — | (0.1) | — | |||||||||||||||||
Adjusted | $ | 1,181.9 | $ | 422.1 | $ | 618.9 | $ | 586.7 | $ | 217.8 | 34.2 | % | $ | 417.7 | $ | 1.01 | ||||||||
% of Net Sales | 29.7 | % | 10.6 | % | 15.6 | % | ||||||||||||||||||
1 Operating profit is derived from taking Income from continuing operations before income taxes and equity method investment earnings, adding back Interest expense, net and removing Pension and postretirement non-service income. |
2 Advertising and promotion expense (A&P) has been removed from adjusted selling, general and administrative expense because this metric is used in reporting to management, and management believes this adjusted measure provides useful supplemental information to assess the Company's operating performance. Please note that A&P is not removed from adjusted profit measures. |
Conagra Brands, Inc. | ||||||||
Reconciliation of Non-GAAP Financial Measures to Reported Financial Measures | ||||||||
(in millions) | ||||||||
Q2 FY19 | Q2 FY18 | % Change | ||||||
Interest expense, net | $ | 80.6 | $ | 38.0 | 112.5 | % | ||
Acquisitions and divestitures | (6.3) | — | ||||||
Adjusted interest expense, net | $ | 74.3 | $ | 38.0 | 95.8 | % | ||
Q2 FY19 | Q2 FY18 | % Change | ||||||
Equity method investment earnings | $ | 37.7 | $ | 20.6 | 83.4 | % | ||
Gain on Ardent JV asset sale | (15.1) | — | ||||||
Adjusted equity method investment earnings | $ | 22.6 | $ | 20.6 | 9.8 | % | ||
Q2 FY19 | Q2 FY18 | % Change | ||||||
Pension and postretirement non-service income | $ | (9.7) | $ | (17.5) | (44.4) | % | ||
Pension settlement and valuation adjustment | — | (4.1) | ||||||
Adjusted pension and postretirement non-service income | $ | (9.7) | $ | (21.6) | (54.9) | % | ||
![]()
SOURCE Conagra Brands, Inc.

Conagra Brands Announces Quarterly Dividend Payment
Conagra Brands, Inc. (NYSE: CAG) today announced that its Board of Directors ...
Conagra Brands Reports Third Quarter Results
Today Conagra Brands, Inc. (NYSE: CAG) reported results for the third quarter ...
Conagra Brands Releases Fiscal Year 2023 Citizenship Report
Conagra Brands, Inc. (NYSE: CAG) today announced the publication of its ...